. 1999 Mar 30;96(7):3975-80.
doi: 10.1073/pnas.96.7.3975.

Blood pressure reduction and diabetes insipidus in transgenic rats deficient in brain angiotensinogen

Affiliations

Blood pressure reduction and diabetes insipidus in transgenic rats deficient in brain angiotensinogen

M Schinke et al. Proc Natl Acad Sci U S A. .

Abstract

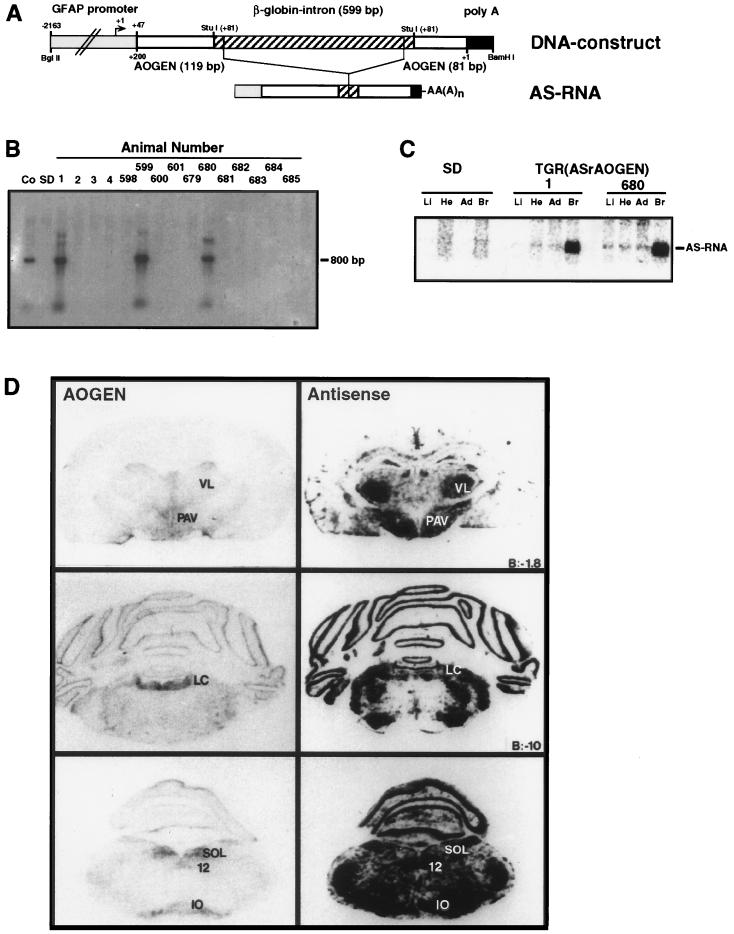
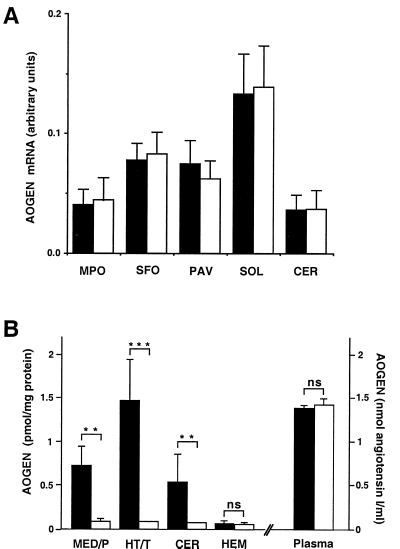
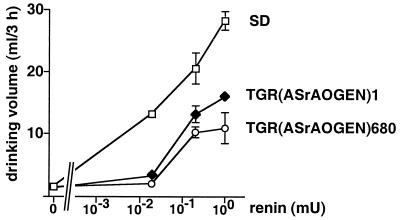
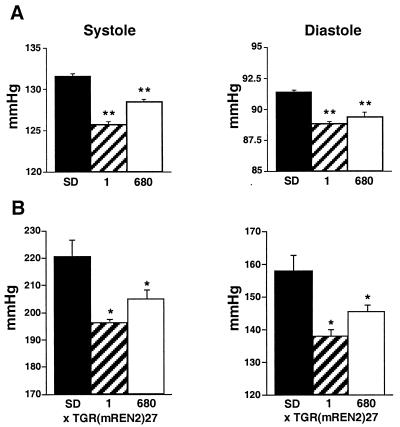
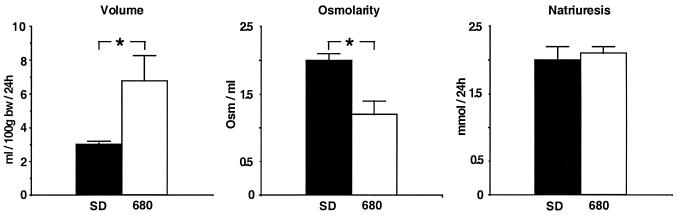
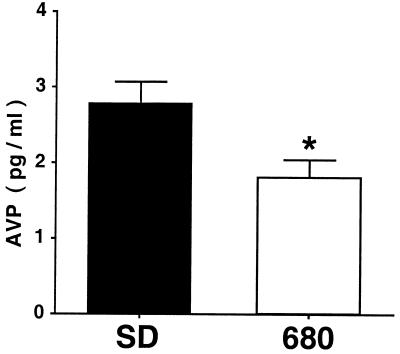
Angiotensin produced systemically or locally in tissues such as the brain plays an important role in the regulation of blood pressure and in the development of hypertension. We have established transgenic rats [TGR(ASrAOGEN)] expressing an antisense RNA against angiotensinogen mRNA specifically in the brain. In these animals, the brain angiotensinogen level is reduced by more than 90% and the drinking response to intracerebroventricular renin infusions is decreased markedly compared with control rats. Blood pressure of transgenic rats is lowered by 8 mmHg (1 mmHg = 133 Pa) compared with control rats. Crossbreeding of TGR(ASrAOGEN) with a hypertensive transgenic rat strain exhibiting elevated angiotensin II levels in tissues results in a marked attenuation of the hypertensive phenotype. Moreover, TGR(ASrAOGEN) exhibit a diabetes insipidus-like syndrome producing an increased amount of urine with decreased osmolarity. The observed reduction in plasma vasopressin by 35% may mediate these phenotypes of TGR(ASrAOGEN). This new animal model presenting long-term and tissue-specific down-regulation of angiotensinogen corroborates the functional significance of local angiotensin production in the brain for the central regulation of blood pressure and for the pathogenesis of hypertension.


Figures

Figure 1
Figure 1
Generation of TGR(ASrAOGEN). (A) DNA construct used for the production of transgenic rats and the resulting structure of the AS RNA. β-globin intron (striped box), second intron with flanking exonic sequences of the rabbit β-globin gene; poly(A), polyadenylation signal of the bovine growth hormone gene. (B) Identification of transgenic rats by Southern blot analysis. Ten micrograms of genomic DNA of each animal (SD rat) and, as control, 1 ng of plasmid DNA containing the transgene (Co) were digested with PvuII and analyzed by Southern blotting. (C) Detection of AS RNA expression by Northern blot analysis in organs of two lines of TGR(ASrAOGEN) and SD rats. Li, liver; Ki, kidney; He, heart; Ad, adrenal; Br, brain. (D) Localization of AS RNA and AOGEN mRNA in the brain of TGR(ASrAOGEN)1. AOGEN mRNA (Left) and AS RNA (Right) were detected in coronal sections of three different brain areas by in situ hybridization. Sol, nucleus of the solitary tract; 12, hypoglossal nucleus; IO, inferior olive; VL, ventrolateral thalamic nucleus; PAV, paraventricular hypothalamic nucleus; LC, locus coeruleus; B, bregma.
Figure 2
Figure 2
AOGEN mRNA (A) and protein (B) concentrations in TGR(ASrAOGEN)1. (A) AOGEN mRNA in median preoptic nucleus (MPO), subfornical organ (SFO), hypothalamic paraventricular nucleus (PAV), nucleus of the solitary tract (SOL), and cerebellum (CER) was densitometrically quantified on autoradiographs of in situ hybridization experiments (see Fig. 1D) using an IBAS. No significant difference was observed between TGR(ASrAOGEN)1 (open bars) and SD rats (solid bars). (B) Brain-AOGEN content was measured in protein extracts of medulla/pons (MED/P), hypothalamus/thalamus (HT/T), cerebellum (CER), and cerebral hemispheres (HEM) in each of eight SD rats (solid bars) and TGR(ASrAOGEN)1 (open bars). Plasma-AOGEN concentration was measured by a radioimmunoassay that quantifies the amount of angiotensin I liberated by an excess of renin. One of two independent experiments is shown. Values are means ± SE. Significance of differences from SD rats were determined by Mann–Whitney U test (∗∗, P < 0.01; ∗∗∗, P < 0.001; ns, not significant).
Figure 3
Figure 3
Drinking volume after i.c.v. renin infusions. The water intake was determined for 3 h after the infusion of the indicated amounts of porcine renin. Values are means ± SE. For the control value (0), 1 milliunit of renin was boiled before infusion.
Figure 4
Figure 4
Blood pressure of TGR(ASrAOGEN) (A) and TGR(ASrAOGEN/mREN2) (B). Systolic (Left) and diastolic (Right) blood pressure was recorded by a telemetric pressure transducer implanted into the aorta. Each group [TGR(ASrAOGEN)1, TGR(ASrAOGEN)680, and SD rats as well as the same lines crossbred with TGR(mREN2)27] consisted of eight males at 16 weeks of age. Values are mean arterial pressures of a continuously measured 2-day interval ± SE. ∗∗, Significantly different (P < 0.01) from SD rats; ∗, significantly different (P < 0.05) from TGR(mREN2)27 as determined by Mann–Whitney U test.
Figure 5
Figure 5
Urinary volume, Na+ concentration, and natriuresis in TGR(ASrAOGEN). Twenty-four-hour urine was collected in TGR(ASrAOGEN) 680 (n = 6; open bars) and SD rats (n = 6; solid bars) and analyzed for osmolarity by an osmometer and for Na+ concentration by flame photometry. Values are means ± SE. ∗, Significantly different (P < 0.05) from SD rats as determined by Mann–Whitney U test.
Figure 6
Figure 6
Plasma AVP in TGR(ASrAOGEN). AVP was measured in plasma of TGR(ASrAOGEN) 680(n = 5; open bars) and SD rats (n = 5; solid bars) by a specific radioimmunoassay. Values are means ± SE. ∗, Significantly different (P < 0.05) from SD rats as determined by Mann–Whitney U test.

Similar articles

Cited by

References

    1. Oparil S, Chen Y-F, Berecek K H, Calhoun D A, Wyss J M. In: Hypertension: Pathophysiology, Diagnosis, and Management. Laragh J H, Brenner B M, editors. New York: Raven; 1995. pp. 713–740.
    1. Freis E D. In: Hypertension: Pathophysiology, Diagnosis, and Management. Laragh J H, Brenner B M, editors. New York: Raven; 1995. pp. 2741–2751.
    1. Reid I A, Morris B J, Ganong W F. Annu Rev Physiol. 1978;40:377–410. - PubMed
    1. Kimura S, Mullins J J, Bunnemann B, Metzger R, Hilgenfeldt U, Zimmermann F, Jacob H, Fuxe K, Ganten D, Kaling M. EMBO J. 1992;11:821–827. - PMC - PubMed
    1. Kim H-S, Krege J H, Kluckman K D, Hagaman J R, Hodgin J B, Best C F, Jennette J C, Coffman T M, Maeda N, Smithies O. Proc Natl Acad Sci USA. 1995;92:2735–2739. - PMC - PubMed

Publication types

MeSH terms