

Functional identification and reconstitution of an odorant receptor in single olfactory neurons
- PMID: 10097159
- PMCID: PMC22416
- DOI: 10.1073/pnas.96.7.4040
Functional identification and reconstitution of an odorant receptor in single olfactory neurons
Erratum in
- Proc Natl Acad Sci U S A 2000 Mar 28;97(7):3782
Abstract
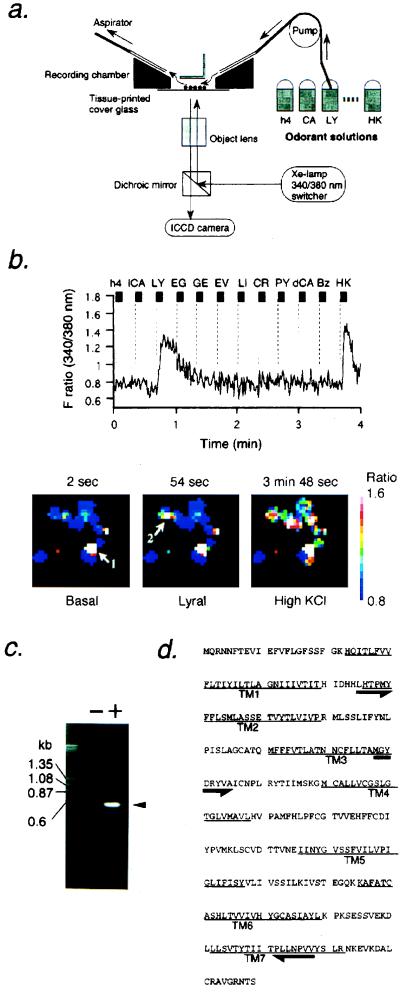
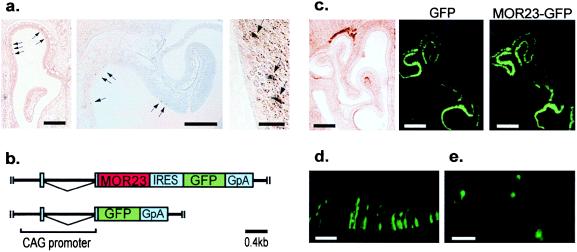
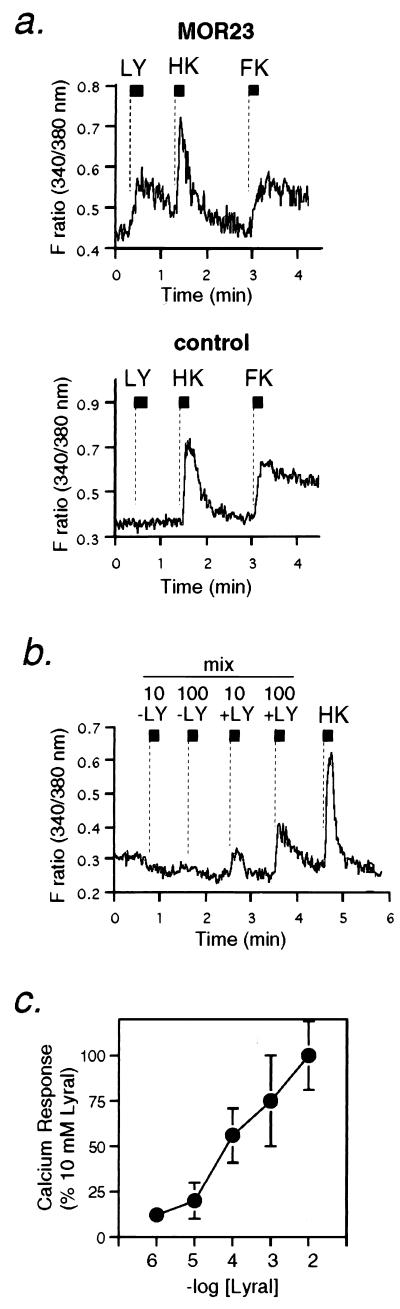
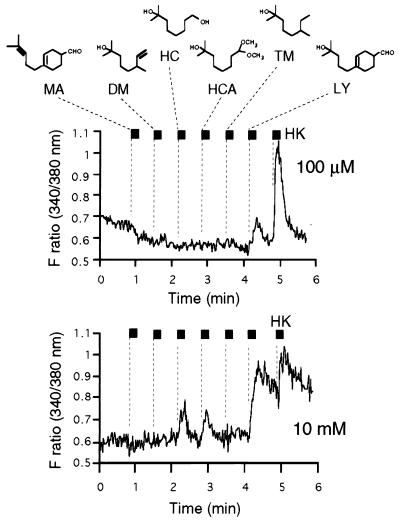
The olfactory system is remarkable in its capacity to discriminate a wide range of odorants through a series of transduction events initiated in olfactory receptor neurons. Each olfactory neuron is expected to express only a single odorant receptor gene that belongs to the G protein coupled receptor family. The ligand-receptor interaction, however, has not been clearly characterized. This study demonstrates the functional identification of olfactory receptor(s) for specific odorant(s) from single olfactory neurons by a combination of Ca2+-imaging and reverse transcription-coupled PCR analysis. First, a candidate odorant receptor was cloned from a single tissue-printed olfactory neuron that displayed odorant-induced Ca2+ increase. Next, recombinant adenovirus-mediated expression of the isolated receptor gene was established in the olfactory epithelium by using green fluorescent protein as a marker. The infected neurons elicited external Ca2+ entry when exposed to the odorant that originally was used to identify the receptor gene. Experiments performed to determine ligand specificity revealed that the odorant receptor recognized specific structural motifs within odorant molecules. The odorant receptor-mediated signal transduction appears to be reconstituted by this two-step approach: the receptor screening for given odorant(s) from single neurons and the functional expression of the receptor via recombinant adenovirus. The present approach should enable us to examine not only ligand specificity of an odorant receptor but also receptor specificity and diversity for a particular odorant of interest.
Figures
Similar articles
-
Functional cloning and reconstitution of vertebrate odorant receptors.Life Sci. 2001 Apr 6;68(19-20):2199-206. doi: 10.1016/s0024-3205(01)01006-2. Life Sci. 2001. PMID: 11358328
-
Molecular bases of odor discrimination: Reconstitution of olfactory receptors that recognize overlapping sets of odorants.J Neurosci. 2001 Aug 15;21(16):6018-25. doi: 10.1523/JNEUROSCI.21-16-06018.2001. J Neurosci. 2001. PMID: 11487625 Free PMC article.
-
Functional expression of a mammalian odorant receptor.Science. 1998 Jan 9;279(5348):237-42. doi: 10.1126/science.279.5348.237. Science. 1998. PMID: 9422698
-
Odor discrimination by G protein-coupled olfactory receptors.Microsc Res Tech. 2002 Aug 1;58(3):135-41. doi: 10.1002/jemt.10131. Microsc Res Tech. 2002. PMID: 12203691 Review.
-
Molecular and cellular basis of human olfaction.Chem Biodivers. 2004 Dec;1(12):1857-69. doi: 10.1002/cbdv.200490142. Chem Biodivers. 2004. PMID: 17191824 Review.
Cited by
-
Olfactory receptors: G protein-coupled receptors and beyond.J Neurochem. 2009 Jun;109(6):1570-83. doi: 10.1111/j.1471-4159.2009.06085.x. Epub 2009 Apr 4. J Neurochem. 2009. PMID: 19383089 Free PMC article. Review.
-
Mammalian olfactory receptors: pharmacology, G protein coupling and desensitization.Cell Mol Life Sci. 2009 Dec;66(23):3743-53. doi: 10.1007/s00018-009-0111-6. Epub 2009 Aug 4. Cell Mol Life Sci. 2009. PMID: 19652915 Free PMC article. Review.
-
Inhibitory signaling in mammalian olfactory transduction potentially mediated by Gαo.Mol Cell Neurosci. 2021 Jan;110:103585. doi: 10.1016/j.mcn.2020.103585. Epub 2020 Dec 25. Mol Cell Neurosci. 2021. PMID: 33358996 Free PMC article.
-
Applying medicinal chemistry strategies to understand odorant discrimination.Nat Commun. 2016 Apr 4;7:11157. doi: 10.1038/ncomms11157. Nat Commun. 2016. PMID: 27040654 Free PMC article.
-
An olfactory sensory neuron line, odora, properly targets olfactory proteins and responds to odorants.J Neurosci. 1999 Oct 1;19(19):8260-70. doi: 10.1523/JNEUROSCI.19-19-08260.1999. J Neurosci. 1999. PMID: 10493727 Free PMC article.
References
Publication types
MeSH terms
Substances
LinkOut - more resources
Full Text Sources
Other Literature Sources
Molecular Biology Databases
Miscellaneous
