. 1999 May;126(9):1793-803.
doi: 10.1242/dev.126.9.1793.

Cis-regulatory elements of the mitotic regulator, string/Cdc25

Affiliations

Cis-regulatory elements of the mitotic regulator, string/Cdc25

D A Lehman et al. Development. 1999 May.

Abstract

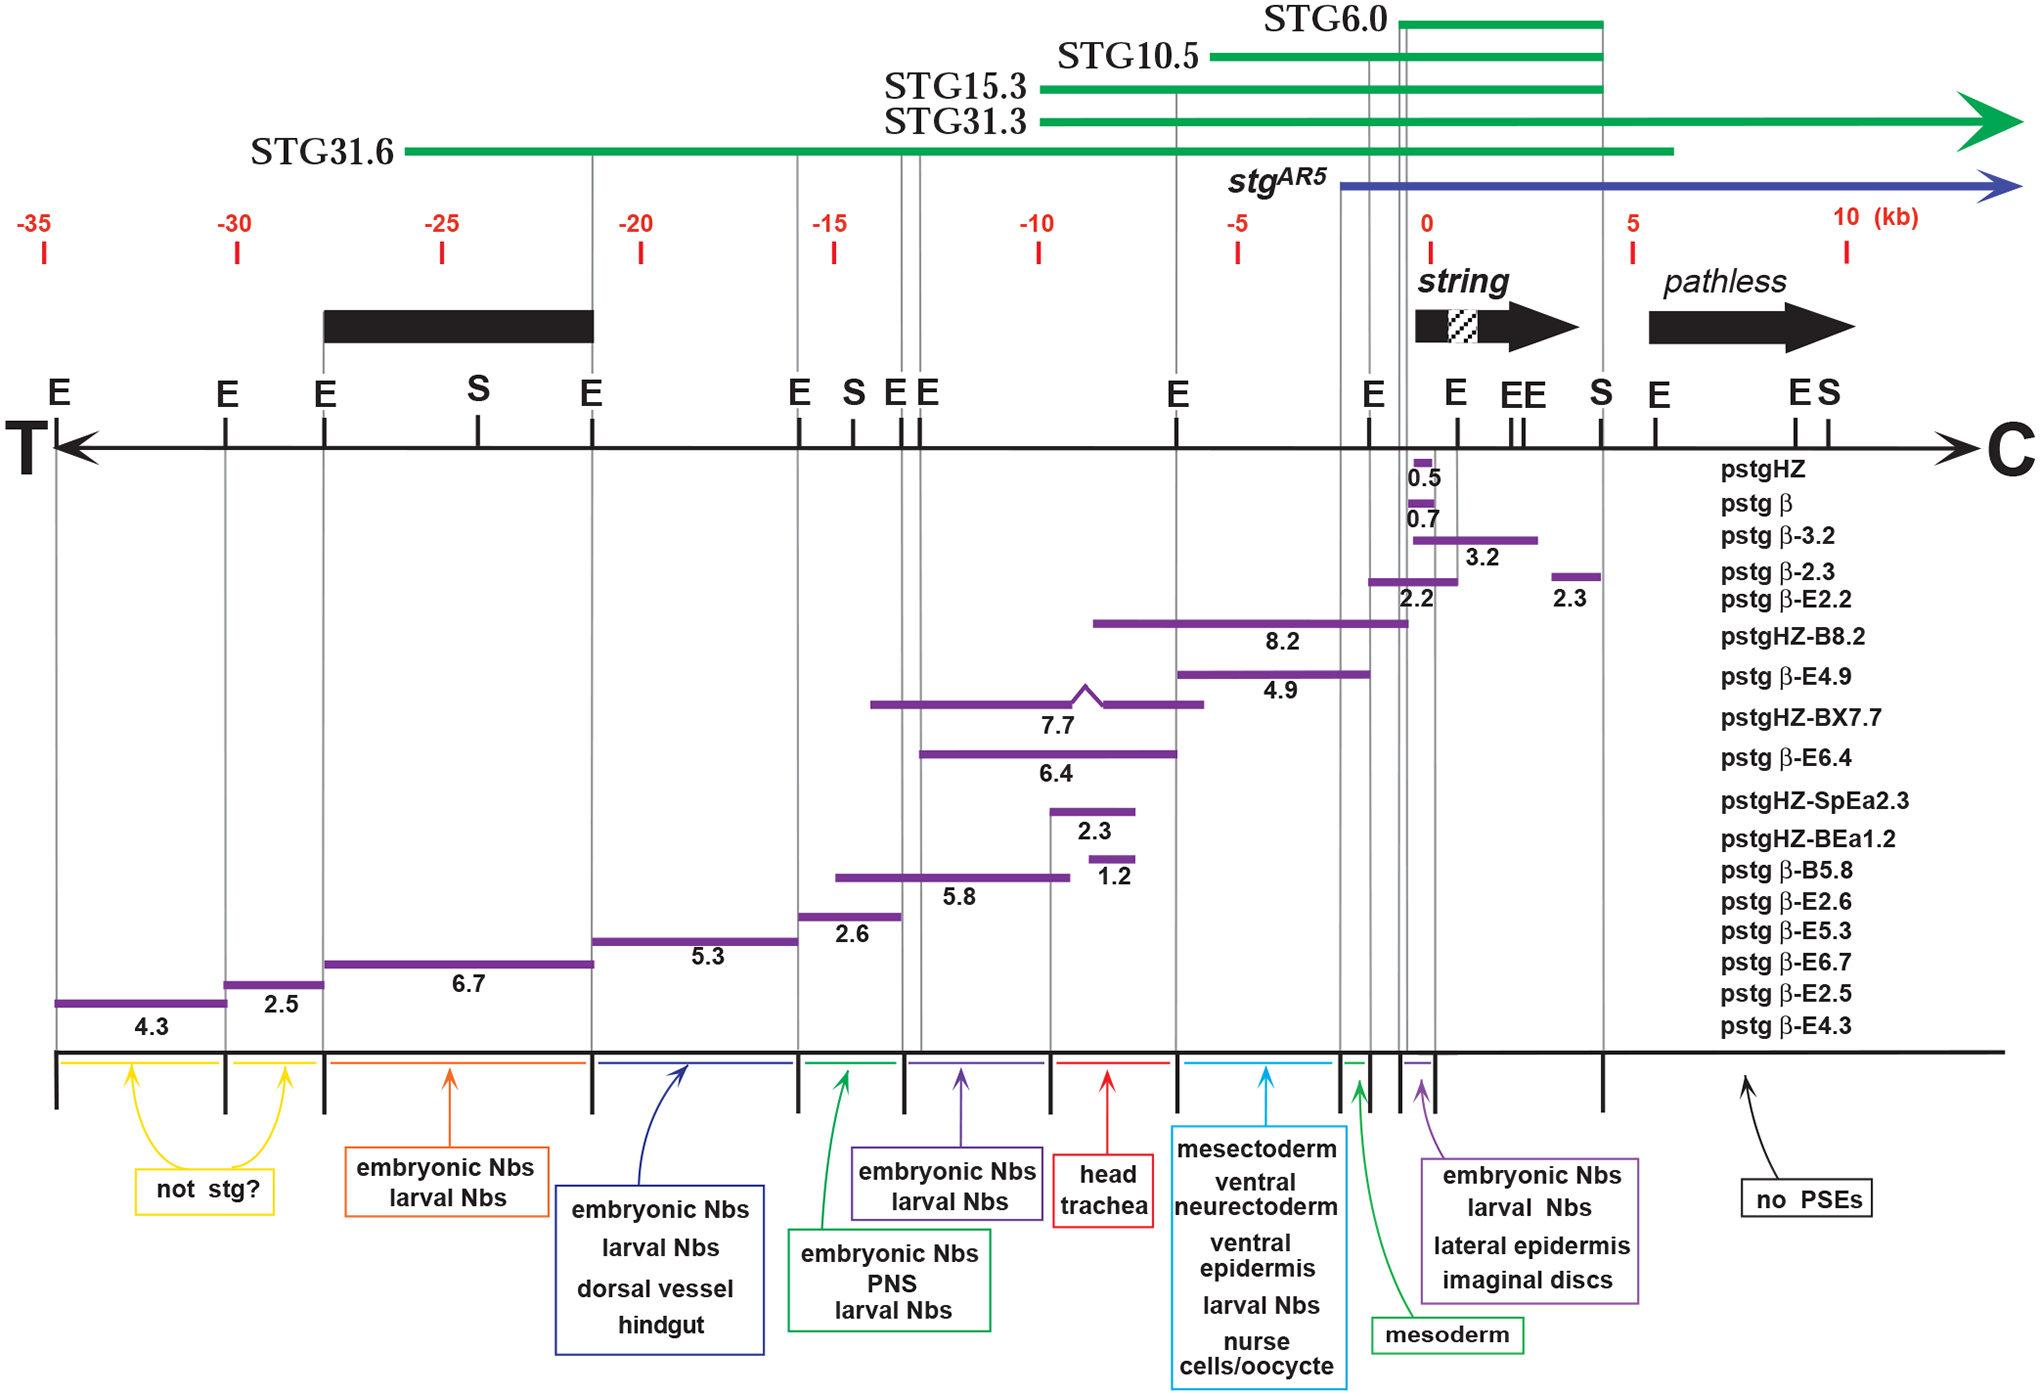
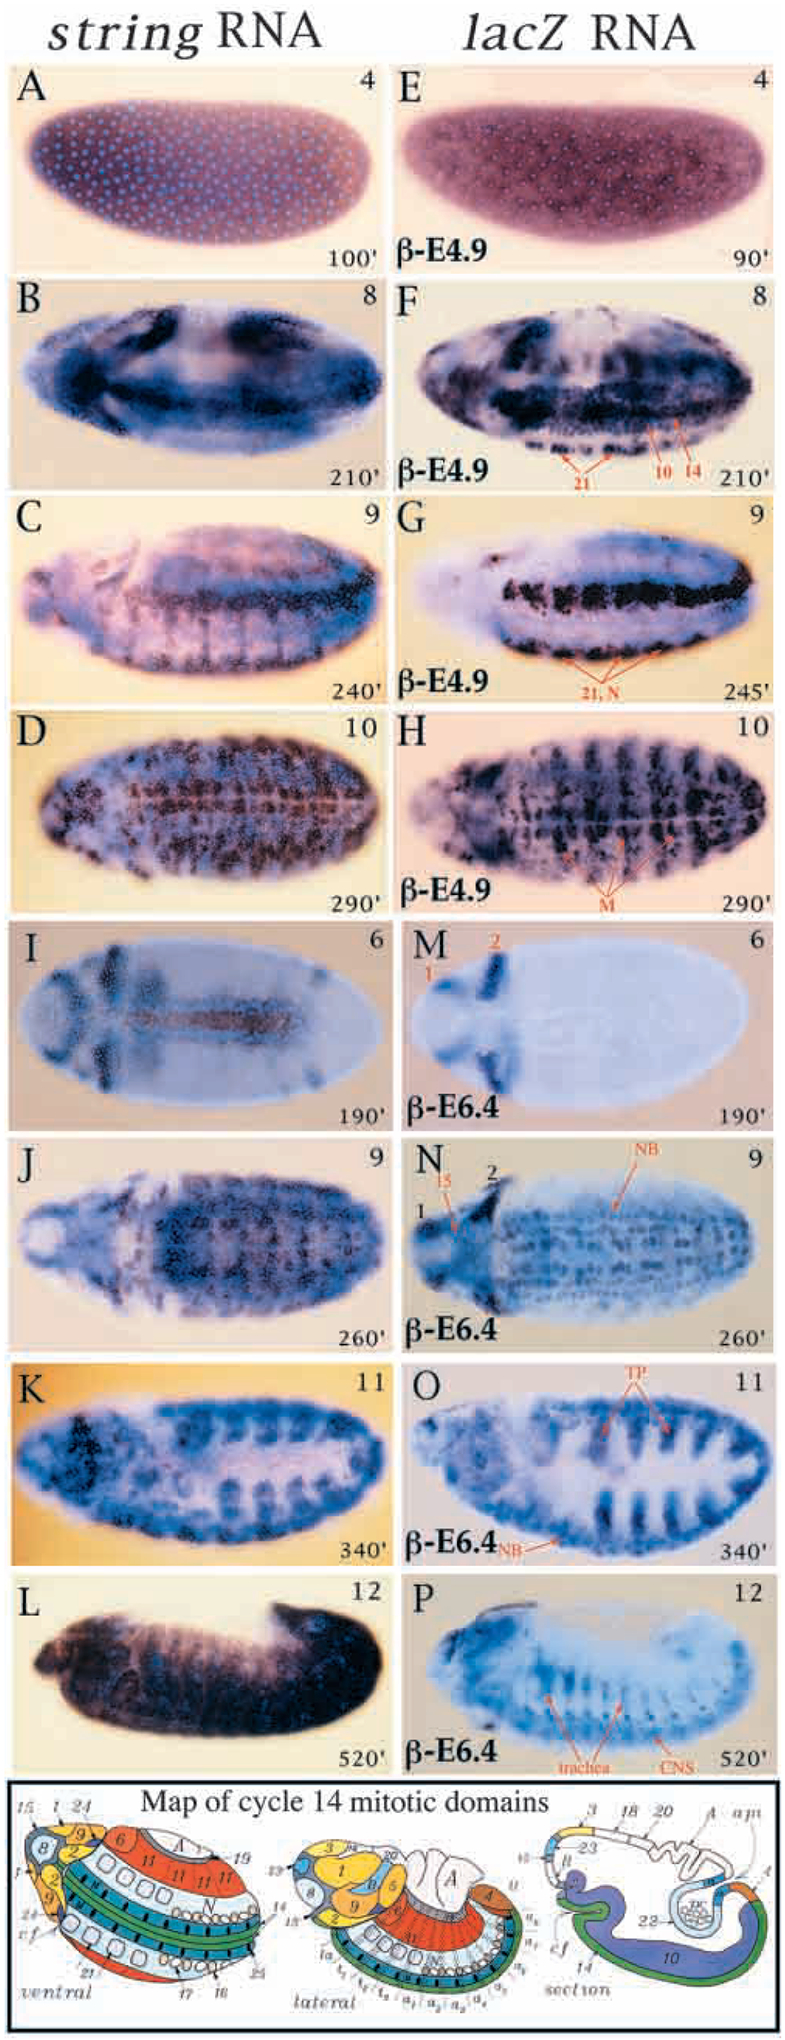
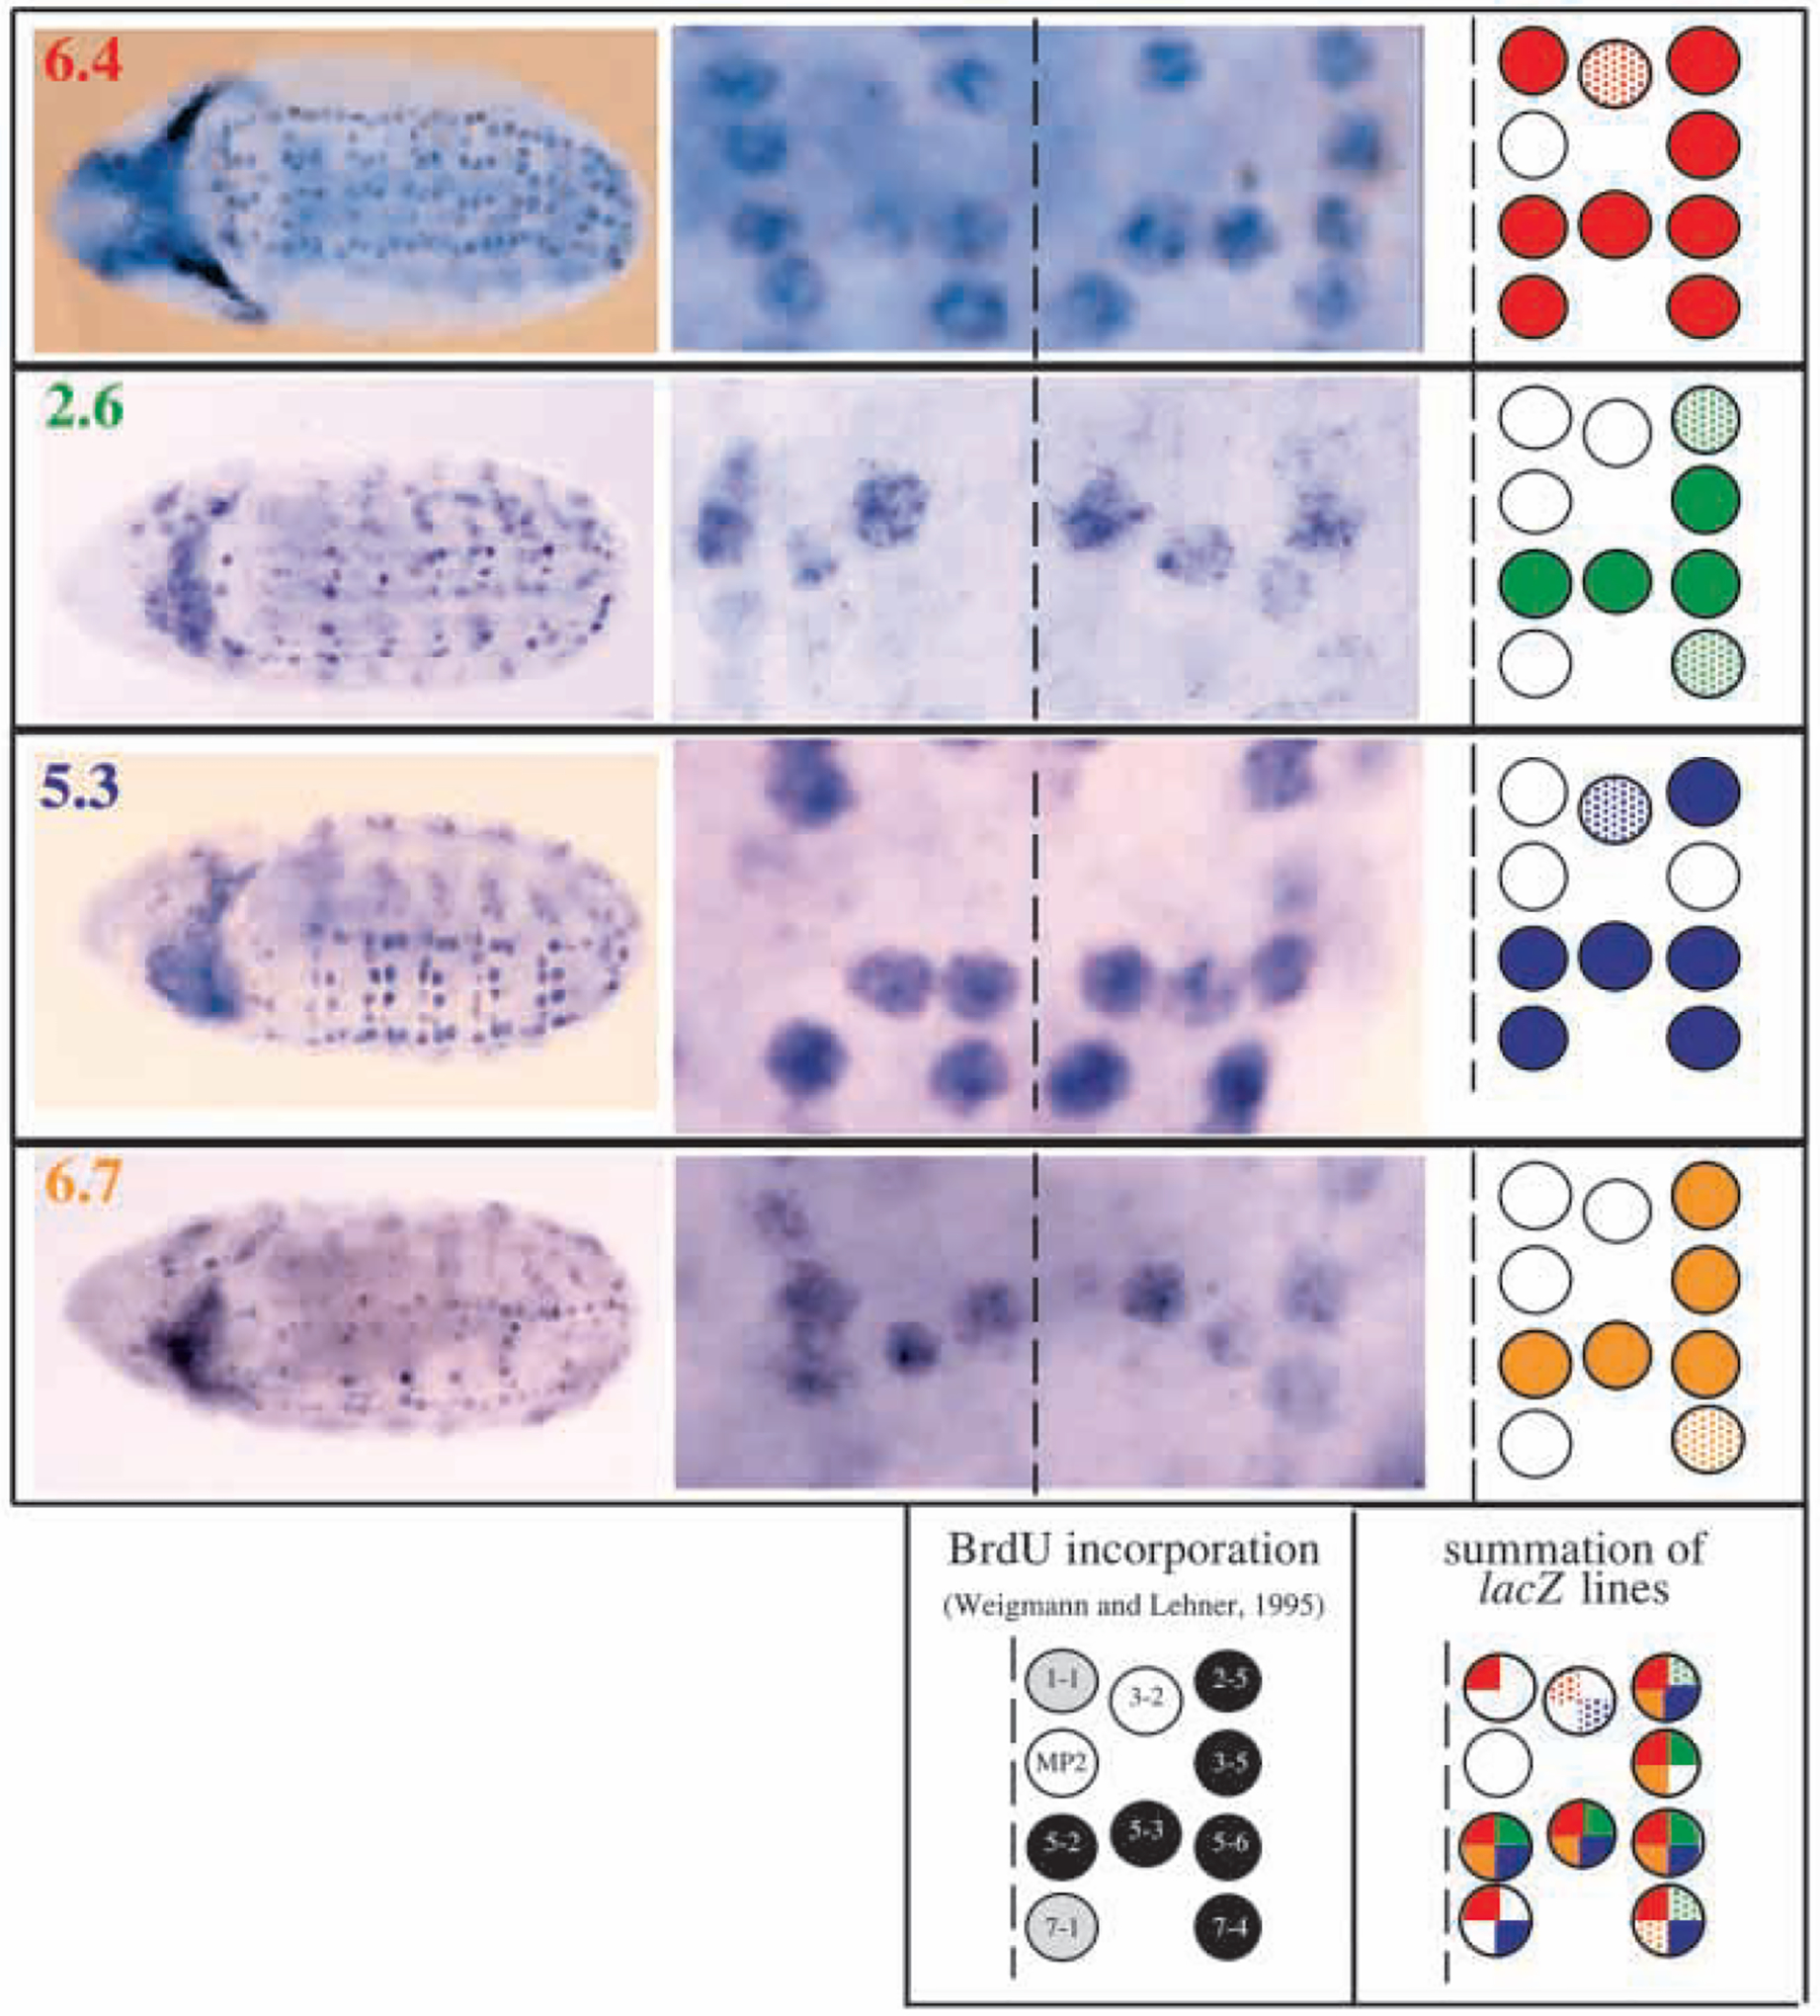
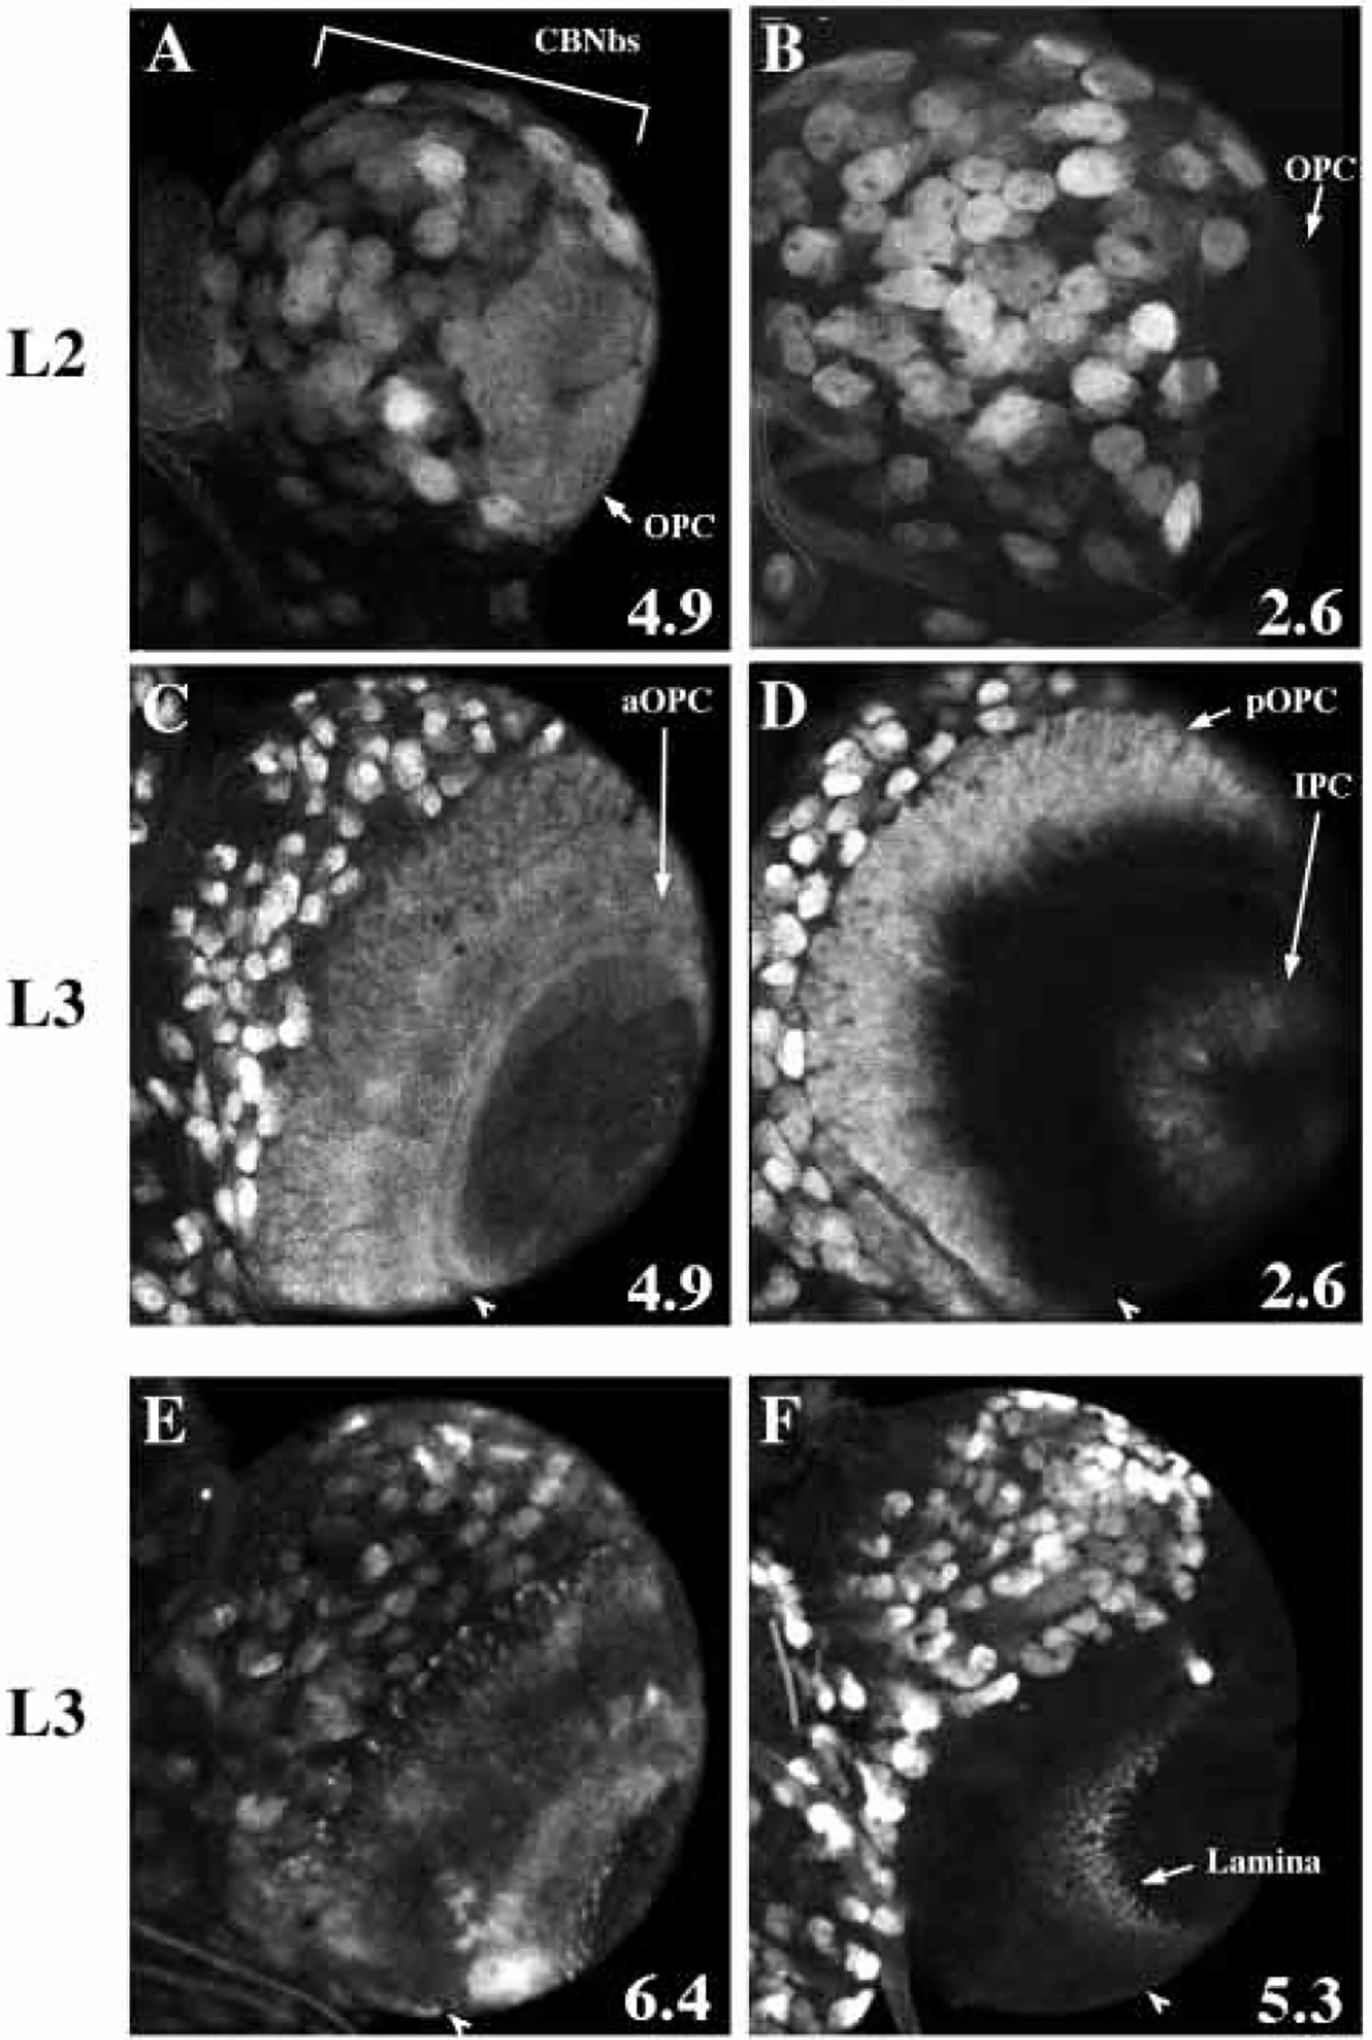
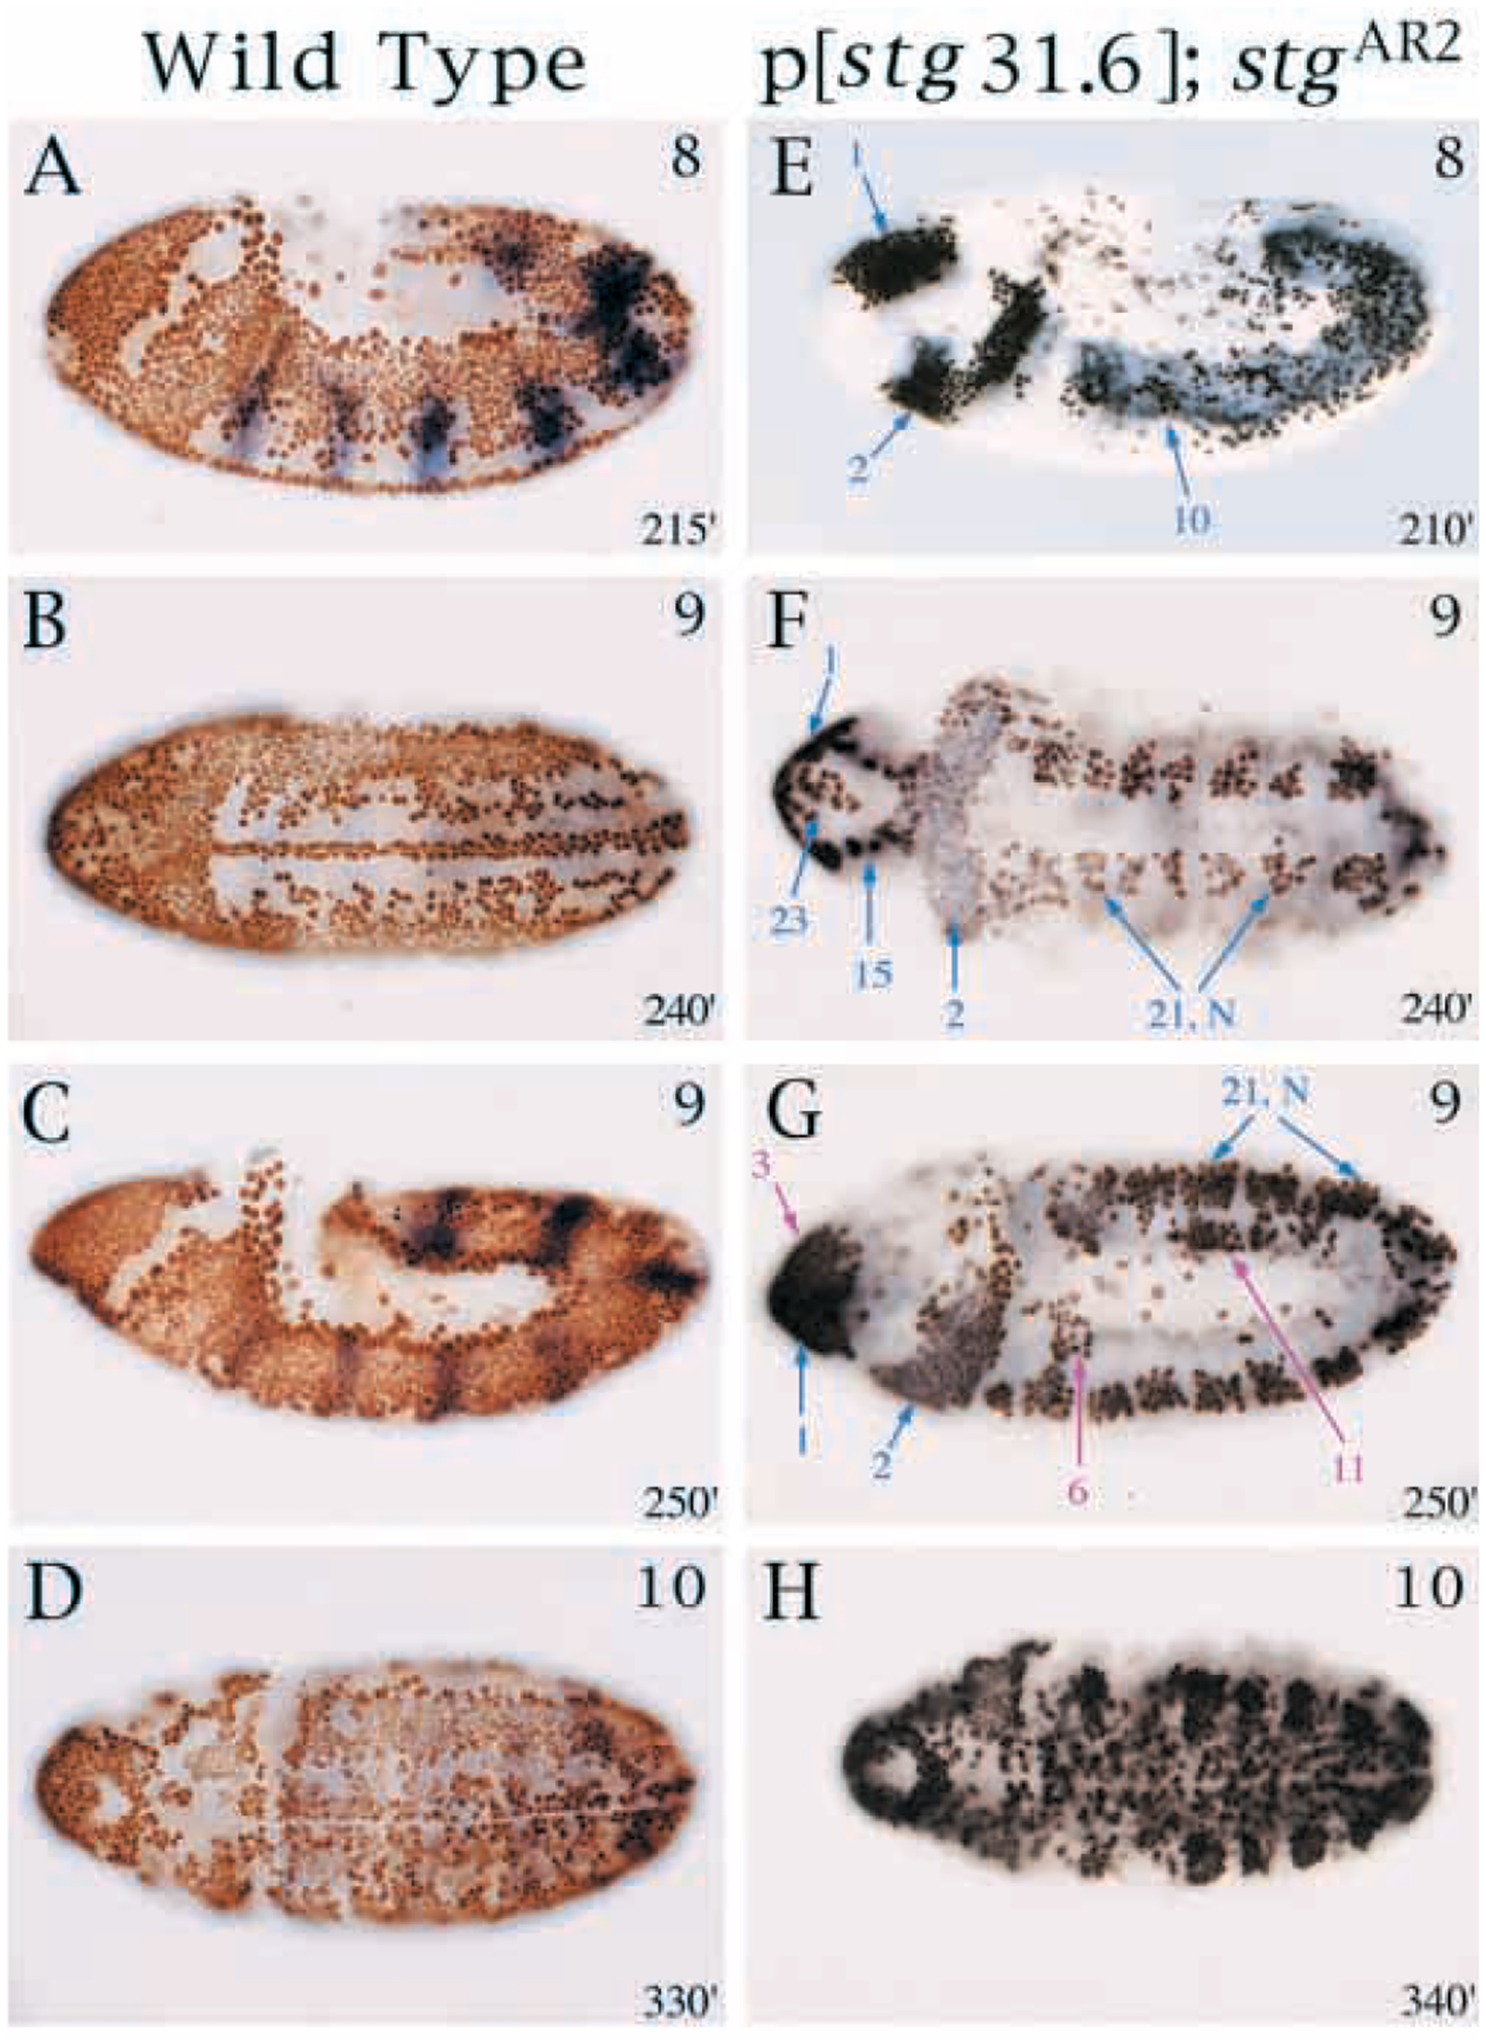
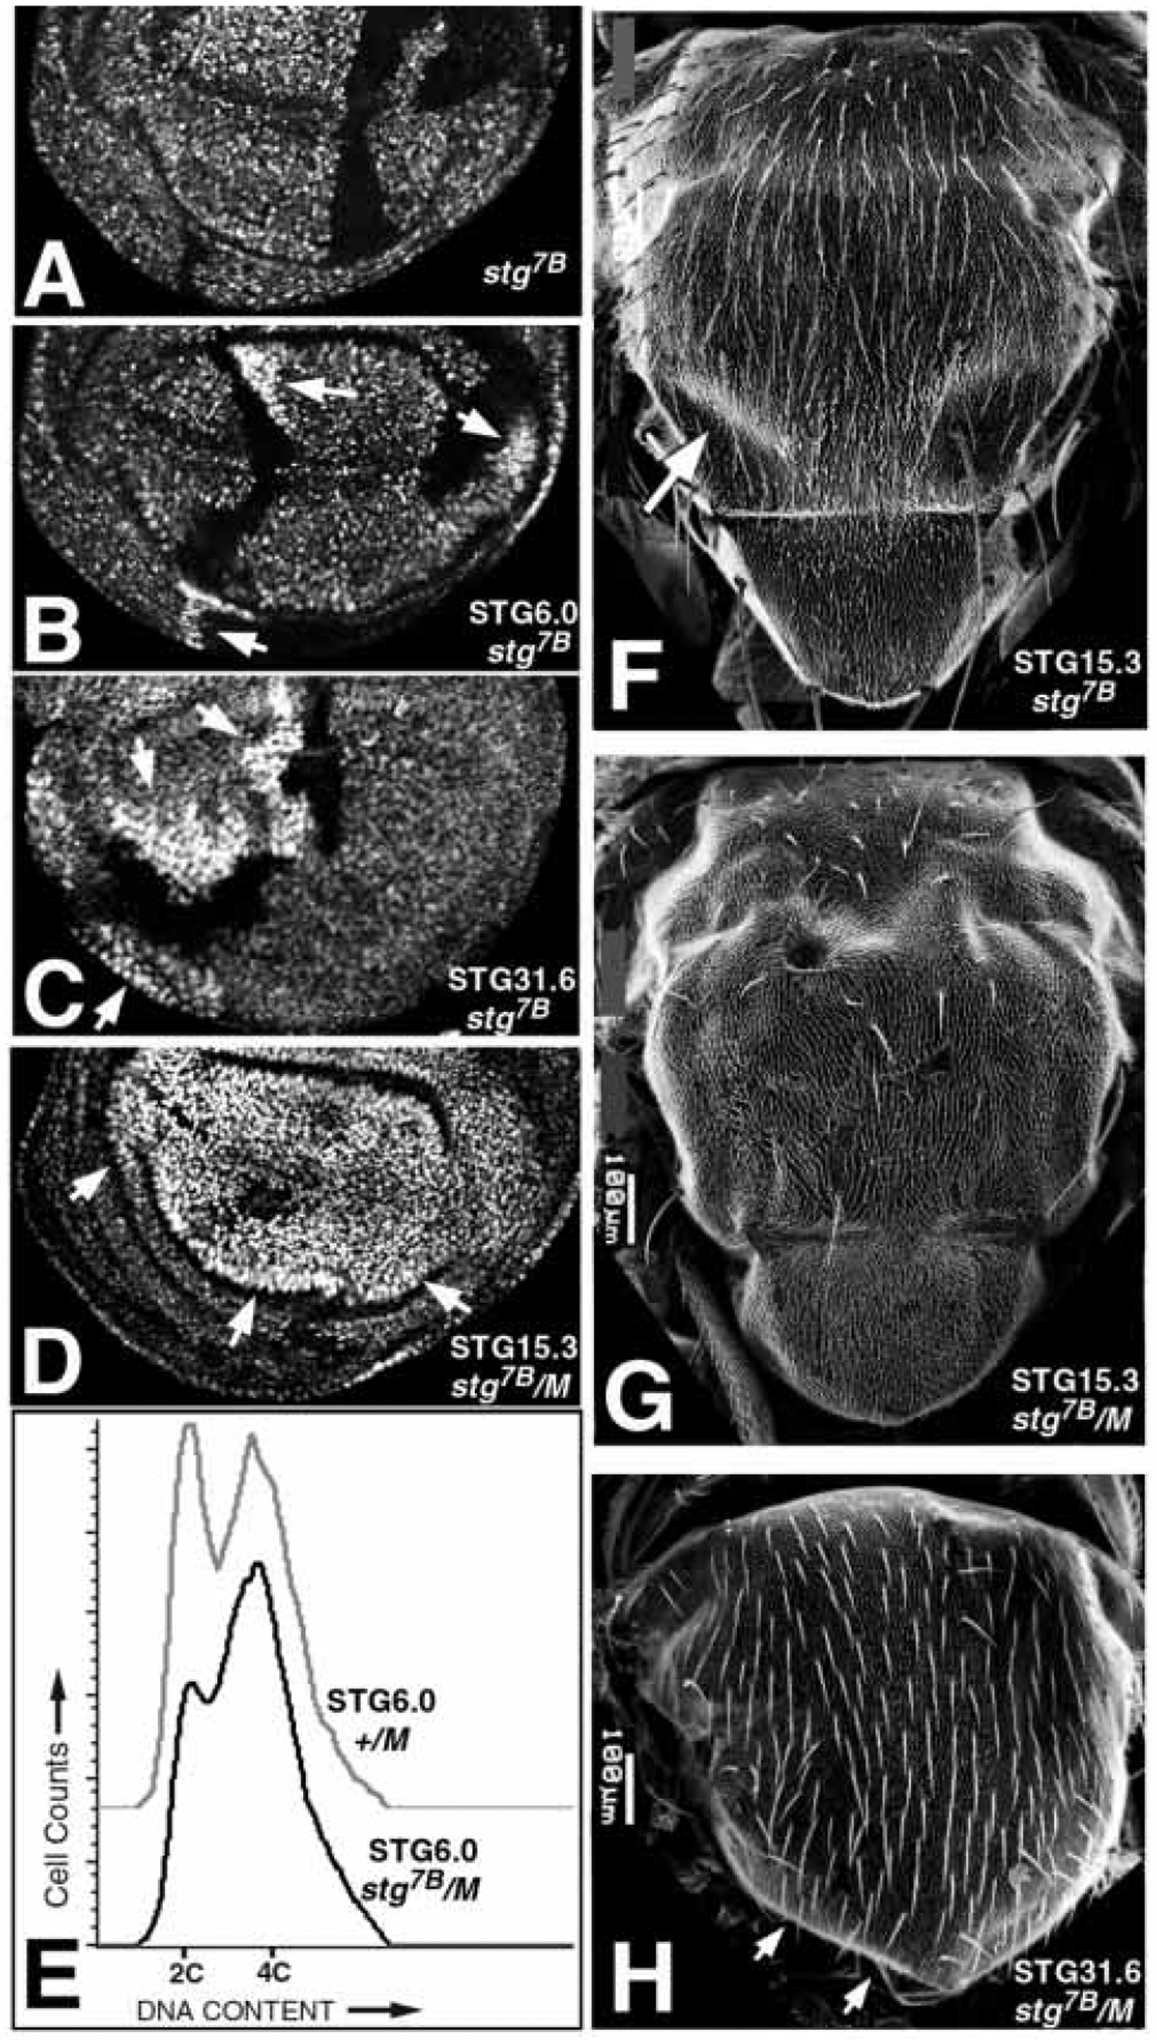
Mitosis in most Drosophila cells is triggered by brief bursts of transcription of string (stg), a Cdc25-type phosphatase that activates the mitotic kinase, Cdk1 (Cdc2). To understand how string transcription is regulated, we analyzed the expression of string-lacZ reporter genes covering approximately 40 kb of the string locus. We also tested protein coding fragments of the string locus of 6 kb to 31.6 kb for their ability to complement loss of string function in embryos and imaginal discs. A plethora of cis-acting elements spread over >30 kb control string transcription in different cells and tissue types. Regulatory elements specific to subsets of epidermal cells, mesoderm, trachea and nurse cells were identified, but the majority of the string locus appears to be devoted to controlling cell proliferation during neurogenesis. Consistent with this, compact promotor-proximal sequences are sufficient for string function during imaginal disc growth, but additional distal elements are required for the development of neural structures in the eye, wing, leg and notum. We suggest that, during evolution, cell-type-specific control elements were acquired by a simple growth-regulated promoter as a means of coordinating cell division with developmental processes, particularly neurogenesis.


Figures

Fig. 1.
Fig. 1.
The ~50 kb genomic region surrounding string. Bold black lines represent transcribed regions, arrows indicate direction of transcription, if known, and the string intron is hatched. A restriction map indicates EcoRI (E) and SalI (S) sites and the directions of the centromere (C) and telomere (T). Above the restriction map, a deletion mutation is indicated in purple (stgAR5), and genomic fragments tested for rescue are indicated in green. Fragments used to drive lacZ expression in transgenic animals are shown below the restriction map in purple, with transgene names to the right. Tissues in which expression is driven by these fragments are indicated in colored boxes, and described in detail in Table 1.
Fig. 2.
Fig. 2.
RNA expression of string-lacZ reporter genes. Wild-type string mRNA expression is shown to the left (A-D, I-L), and lacZ mRNA expression in correspondingly staged pstgβ-E4.9 (E-H) and pstgβ-E6.4 (M-P) embryos is shown to the right. Stages are indicated in upper right corners and approximate ages in minutes AED at 25°C are indicated in bottom right corners of each panel. Most embryos are also stained with DNA stain, Hoescht 33258, to illuminate nuclei (light blue). Note views of embryos: (A-C,E-G) ventrolateral; (D,H-J,M,N) ventral; (K,L,O,P) lateral. (A) Maternal stg expression in cycle 12. (E) Maternal lacZ expression in cycle 11. (B) stg expression in MD 1–14 of cycle 14. (F) lacZ expression in MDs 10, 14 and 21 of cycle 14; note the early expression in MD 21 compared to wild type and a lack of expression in the head and lateral epidermis. (C) stg expression in cycle 14 MDs 21–25 and N, cycle 15 expression in the head and lateral epidermis. (G) lacZ expression in cycle 14 MDs 21 and N. (D) stg expression in cycle 14 MD M and cycle 15 expression in the head, ventrolateral epidermis, ventral neurectoderm and neuroblasts. (H) lacZ expression in cycle 14 MD M and cycle 15 ventral neurectoderm; staining in lateral epidermis is background from vector (see results). (I) stg expression in cycle 14 MDs 1–10. (M) lacZ expression in cycle 14 MDs 1 and 2; note lack of expression in domains 3–10. (J) stg expression in cycle 14 MDs M, N and 25 and neuroblasts; cycle 15 expression in the head and lateral epidermis. (N) lacZ expression in cycle 14 MD 15 and neuroblasts (NB), (note that lacZ mRNA persists in MD 15 as it is more stable than string mRNA); cycle 15 expression in the head (subdivisions of MD 1, 2); note lack of expression in cycle 14 MDs M, N, 25 and cycle 15 lateral epidermis. (K) stg expression in tracheal placodes (TP) during cycle 16, expression also in ventral neurectoderm, neuroblasts and head. (O) lacZ expression in tracheal placodes during cycle 16, expression also in neuroblasts and restricted domains in the head. (L) cycle 16 stg expression in the epidermis. (P) lacZ expression is limited to trachea, CNS, brain and head. Bottom: a map of the cycle 14 mitotic domains reproduced from Foe (1989). Mitotic domains are indicated by distinct colors and are numbered according to the order in which they divide.
Fig. 3.
Fig. 3.
Overlapping patterns of embryonic S1 neuroblast expression driven by pstgβ-E6.4, pstgβ-E2.6, pstgβ-E5.3 and pstgβ-E6.7. Neuroblast expression at stage 9 is shown in whole embryos (left) and first abdominal segments (center). The midline of each segment is represented by a dashed line. As the timing of delamination and the position of neuroblasts varied slightly, more than 30 embryos from each line were analyzed to define the patterns represented schematically (rightmost column). Neuroblasts that express lacZ consistently are represented by solid colored circles. Neuroblasts that show weak, late or inconsistent expression are stippled. Neuroblasts that lack expression are represented by empty circles. A schematic representing the pattern of BrdU incorporation in S1 neuroblasts (Weigmann and Lehner, 1995) is included below. Black circles represent the neuroblasts that divide first, stippled circles represent the neuroblasts that divide second, and white circles represent the last S1 neuroblasts to divide. A schematic representing the summation of the lacZ lines is depicted in the lower right. Each circle is colored with the appropriate number of solid or stippled quarters that represent strong or weak expression driven by individual lines.
Fig. 4.
Fig. 4.
β-gal protein expression in the larval CNS driven by four string-lacZ lines. All views are of a single brain lobe from the ventral side. (A,B) In the second instar optic lobe, pstgβ-E4.9 drives expression in the outer proliferation center (OPC) while pstgβ-E2.6 does not (arrows). Bracket in A marks the central brain region (CBNbs). (C-F) Four classes of expression pattern observed in the third instar optic lobe. Arrowheads indicate the lamina furrow in each panel as a landmark. (C) pstgβ-E4.9 drives β-gal expression in the anterior OPC (aOPC) and posterior OPC (pOPC). (D) pstgβ-E2.6 drives expression in the pOPC and inner proliferation center (IPC). (E) pstgβ-E6.4 drives expression in cells that lie under the surface of the brain, and are most likely progeny of the OPC and IPC neuroblasts. (F) pstgβ-E5.3 drives expression in lamina cells. lacZ transcript was undetectable by in situ hybridization in most larval neuroblasts, suggesting that the 0.7 kb promoter element drives transcription in these cells at a very low level. Since β-gal protein is stable, the expression patterns shown are presumably due to the accumulation β-gal protein over many hours of development.
Fig. 5.
Fig. 5.
Embryonic cell cycles driven by a 31.6 kb string transgene. (A-D) Normal BrdU incorporation in control P[w+STG31.6]; stgAR2/TM3 Sb (P[ry+ ftz -lacZ]) embryos. (E-H) BrdU incorporation driven by the 31.6 kb transgene in a homozygous string null background; P[w+STG31.6]; stgAR2. All embryos are labeled with BrdU (brown or black stain) for 1 hour at 25°C and anti-β-gal antibody (blue) to detect the balancer. Approximate stages are indicated in upper right corner and age in minutes AED at 25°C is indicated in bottom right corners. Note views of embryos: (A,C,E,G) lateral; (B,D,F,H) ventral. (E-G) Mitotic domains driven by the 31.6 kb transgene that are also activated by individual PSEs are indicated by blue arrows. Mitotic domains in which cell division is driven by the 31.6 but not by the individual lacZ lines are indicated by fuchsia arrows and include cycle 15 MD, 3, 6 and parts of 11. BrdU incorporation in cycle 14 MDs 11 and 14, and cycle 15 MD 19 occurs but is inconsistent (data not shown). (H) Additional cycle 15 domains incorporate BrdU.
Fig. 6.
Fig. 6.
Partial rescue of imaginal disc cell proliferation by string transgenes as small as 6.0 kb. (A-D) Wing imaginal discs in which clones of stg7B cells were induced at 48 hours AED. stg7B π-myc/stg7B π-myc mutant cells are brightly stained (arrows), their +/+ twinspots are black and stg7B π-myc/+ cells are moderately stained. (A) Complete loss of non-dividing stg7B cells. (B) Rescue of stg7B cells by the P[STG6.0] transgene, giving clones of >20 cells. (C) Rescue of stg7B cells by the P[STG31.6] transgene, giving clones equal in size to their twinspots. (D) Rescue of stg7B cells by the P[STG15.3] transgene in a Minute background, giving a clone(s) that encompasses the entire wing pouch; no twin-spots are present. (E) FACS analysis of imaginal discs showing elongation of the G2 phase in stg7B P[STG6.0] cells. Discs were heat-shocked for 2 hours at 37°C at 48 hours AED to induce mitotic recombination, and homozygosity for stg7B, in virtually all cells. See Neufeld et al. (1998) for methods. (F) A missing posterior dorsocentral macrochaete (arrow) in a notum in which clones of stg7B cells were rescued by the P[STG15.3] transgene. (G) Extensive loss of macrochaetae and microchaetae in a notum containing large clones of stg7B cells generated using the Minute technique and rescued by the P[STG15.3] transgene (as in D). (H) Loss of macrochaetae and the scutellum (arrows) in a notum derived from stg7B P[STG31.6] cells, also using a Minute. See Methods for genotypes.

Similar articles

Cited by

References

    1. Arora K and Nüsslein-Volhard C (1992). Altered mitotic domains reveal fate map changes in Drosophila embryos mutant for zygotic dorsoventral patterning genes. Development 114, 1003–1024. - PubMed
    1. Bodmer R, Carretto R and Jan YN (1989). Neurogenesis of the peripheral nervous system in Drosophila embryos: DNA replication patterns and cell lineages. Neuron 3, 21–32. - PubMed
    1. Breeden L (1996). Start-specific transcription in yeast. Curr. Topics Microbiol. Immunol 208, 95–127. - PubMed
    1. Campos-Ortega JA and Hartenstein V (1985). The Embryonic Development of Drosophila melanogaster Berlin: Springer-Verlag.
    1. Crozatier M, Valle D, Dubois L, Ibnsouda S and Vincent A (1996). collier, a novel regulator of Drosophila head development, is expressed in a single mitotic domain. Curr. Biol 6, 707–718. - PubMed

Publication types

MeSH terms