. 1999 Apr;113(4):581-600.
doi: 10.1085/jgp.113.4.581.

Distinct transient outward potassium current (Ito) phenotypes and distribution of fast-inactivating potassium channel alpha subunits in ferret left ventricular myocytes

Affiliations

Distinct transient outward potassium current (Ito) phenotypes and distribution of fast-inactivating potassium channel alpha subunits in ferret left ventricular myocytes

M V Brahmajothi et al. J Gen Physiol. 1999 Apr.

Abstract

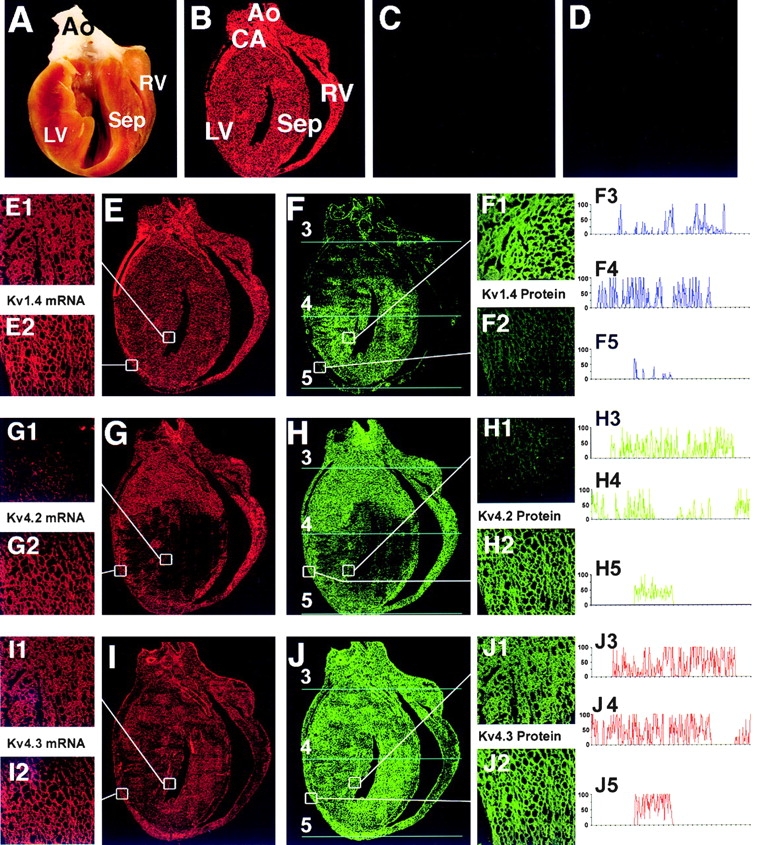
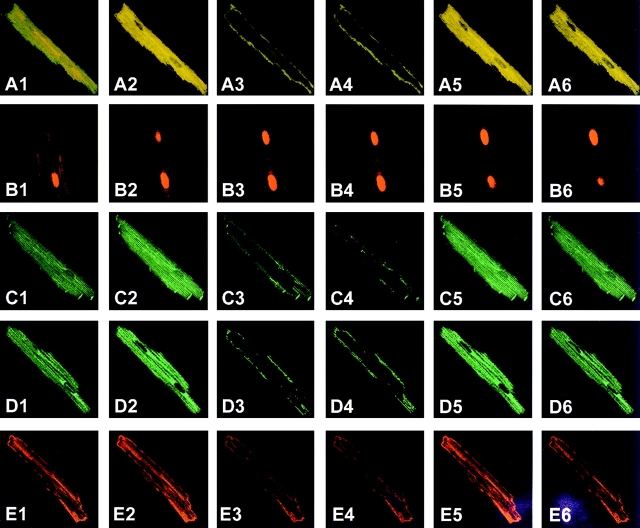
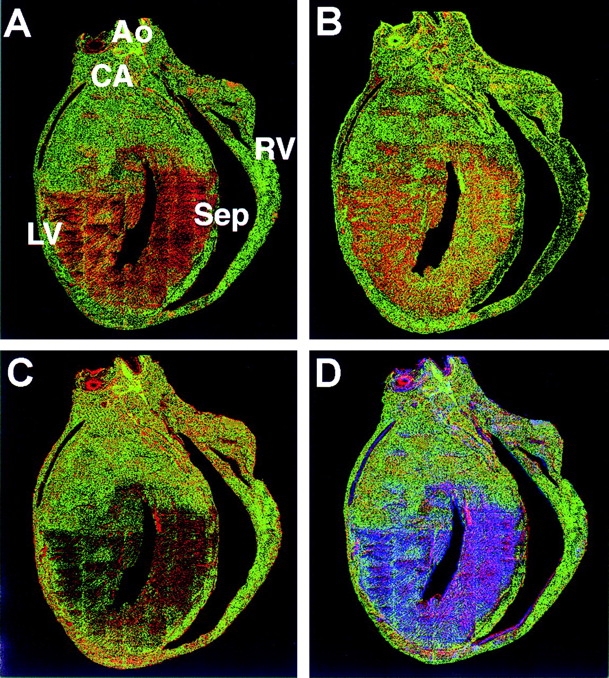
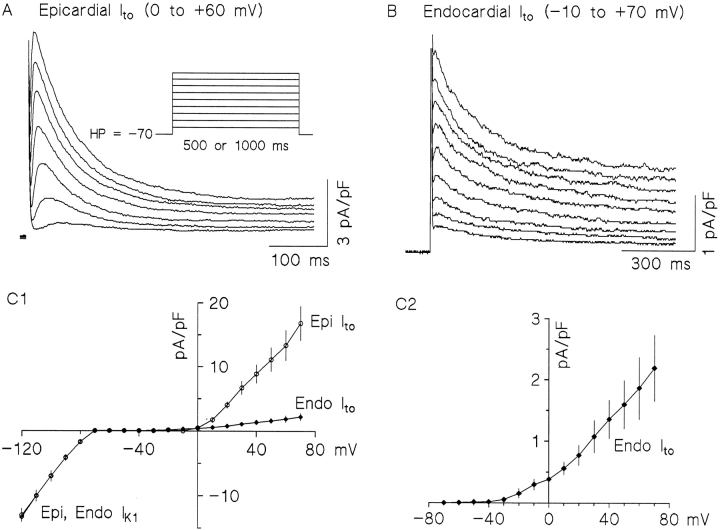
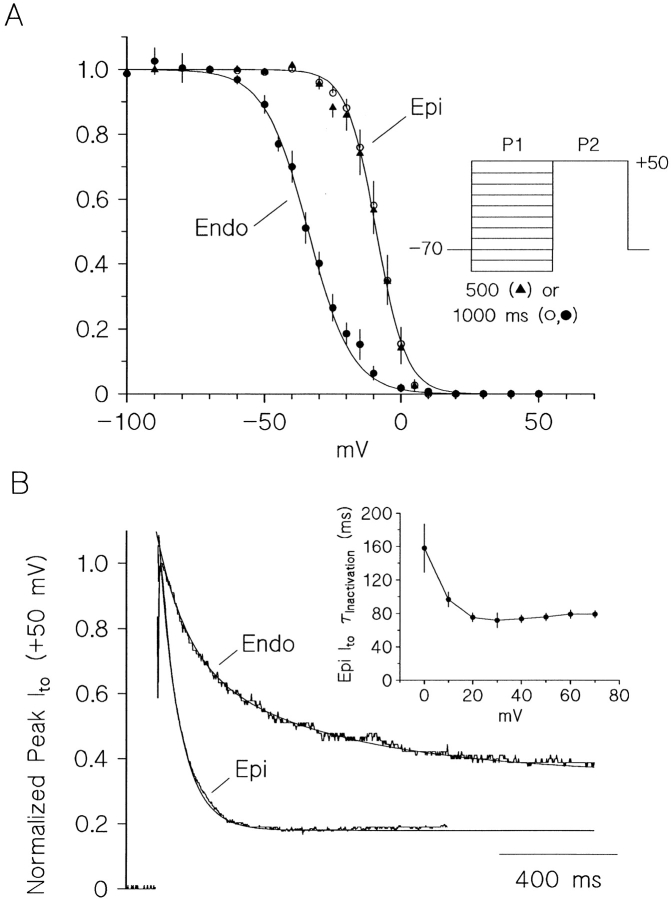
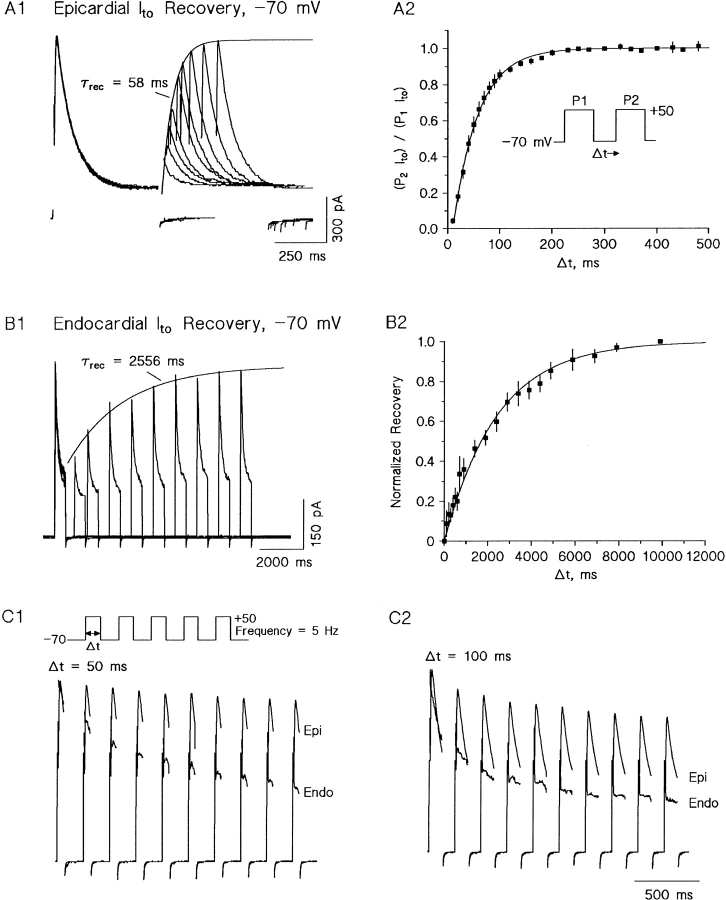
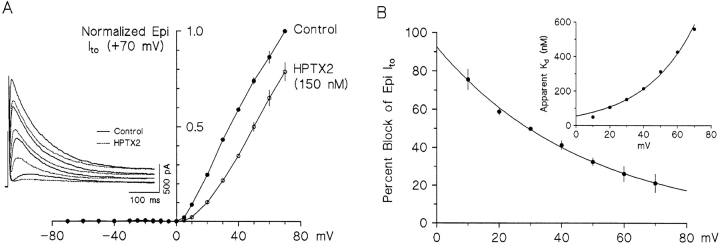
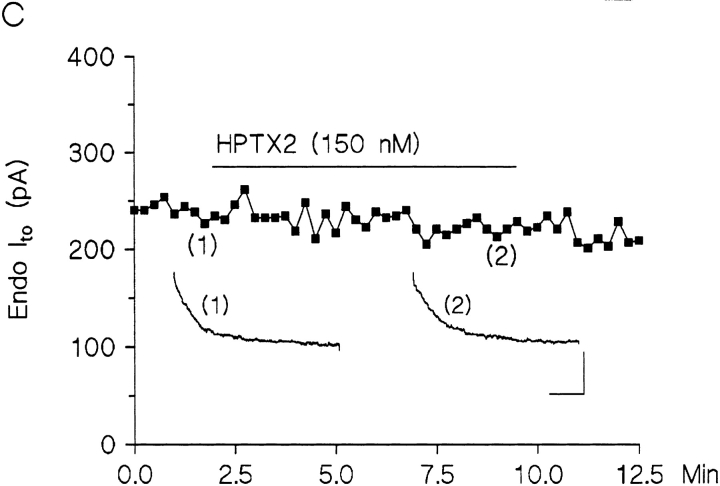
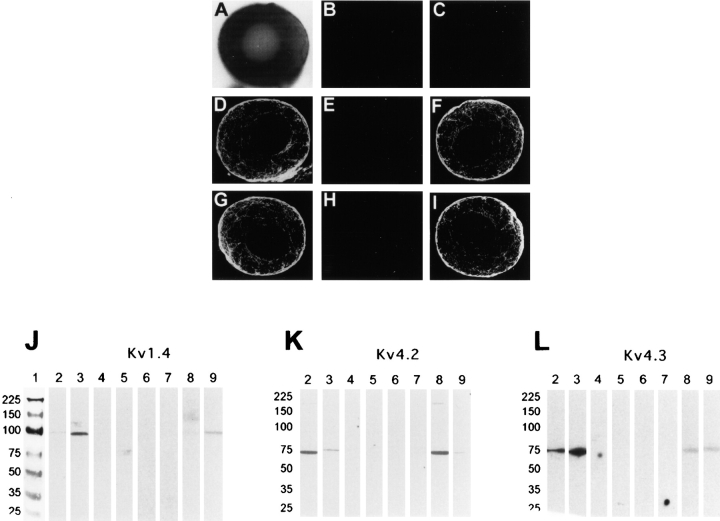
The biophysical characteristics and alpha subunits underlying calcium-independent transient outward potassium current (Ito) phenotypes expressed in ferret left ventricular epicardial (LV epi) and endocardial (LV endo) myocytes were analyzed using patch clamp, fluorescent in situ hybridization (FISH), and immunofluorescent (IF) techniques. Two distinct Ito phenotypes were measured (21-22 degrees C) in the majority of LV epi and LV endo myocytes studied. The two Ito phenotypes displayed marked differences in peak current densities, activation thresholds, inactivation characteristics, and recovery kinetics. Ito,epi recovered rapidly [taurec, -70 mV = 51 +/- 3 ms] with minimal cumulative inactivation, while Ito,endo recovered slowly [taurec, -70 mV = 3,002 +/- 447 ms] with marked cumulative inactivation. Heteropoda toxin 2 (150 nM) blocked Ito,epi in a voltage-dependent manner, but had no effect on Ito,endo. Parallel FISH and IF measurements conducted on isolated LV epi and LV endo myocytes demonstrated that Kv1.4, Kv4.2, and Kv4.3 alpha subunit expression in LV myocyte types was quite heterogenous: (a) Kv4.2 and Kv4.3 were more predominantly expressed in LV epi than LV endo myocytes, and (b) Kv1.4 was expressed in the majority of LV endo myocytes but was essentially absent in LV epi myocytes. In combination with previous measurements on recovery kinetics (Kv1.4, slow; Kv4.2/4.3, relatively rapid) and Heteropoda toxin block (Kv1.4, insensitive; Kv4.2, sensitive), our results strongly support the hypothesis that, in ferret heart, Kv4.2/Kv4.3 and Kv1.4 alpha subunits, respectively, are the molecular substrates underlying the Ito,epi and Ito,endo phenotypes. FISH and IF measurements were also conducted on ferret ventricular tissue sections. The three Ito alpha subunits again showed distinct patterns of distribution: (a) Kv1.4 was localized primarily to the apical portion of the LV septum, LV endocardium, and approximate inner 75% of the LV free wall; (b) Kv4. 2 was localized primarily to the right ventricular free wall, epicardial layers of the LV, and base of the heart; and (c) Kv4.3 was localized primarily to epicardial layers of the LV apex and diffusely distributed in the LV free wall and septum. Therefore, in intact ventricular tissue, a heterogeneous distribution of candidate Ito alpha subunits not only exists from LV epicardium to endocardium but also from apex to base.


Figures

Figure 7
Figure 7
Ferret ventricular sagittal section analysis: comparison of Kv1.4, Kv4.2, and Kv4.3 α subunit mRNA transcript (FISH; red fluorescence) and protein (indirect IF; green fluorescence) expression levels. Results obtained from adjacent sagittal sections (7-μm thickness). (A) Photographic view of a sagittal cut made through the ferret heart. Note that in all subsequent panels of whole sagittal sections that the atria have been removed for illustrative purposes. AO, aorta; CA, coronary artery; Sep, septum; LV, left ventricle; RV, right ventricle. (B and C) FISH: (B) positive control signal to TnIc (Brahmajothi et al., 1997) antisense probe and (C) negative control signal to TnIc sense probe. (D) Indirect IF: negative control signal for Kv4.2/4.3 in response to application of secondary antibody (fluorochrome-conjugated anti–rabbit IgG) in the absence of primary antibodies. Similar results (not shown) were obtained for Kv1.4 after application of fluorochrome-conjugated anti–mouse IgG in the absence of primary antibody. E, G, and I are FISH results and F, H, and J are IF results. Smaller numbered panels correspond to enlarged sections (60×) taken from selected LV epi and LV endo regions indicated by the white boxes. (E, G, and I) FISH: mRNA transcript expression patterns. (E, E1, and E2) Kv1.4 mRNA, (G, G1, and G2) Kv4.2 mRNA, and (I, I1, and I2) Kv4.3 mRNA. (F, H, and J) Indirect IF: α subunit protein expression patterns. (F, F1, and F2) Kv1.4 protein, (H, H1, and H2) Kv4.2 protein, and (J, J1, and J2) Kv4.3 protein. Note that, while there is a general correspondence between both Kv4.2 and Kv4.3 mRNA and protein expression levels, Kv1.4 mRNA and protein levels do not correlate; i.e., Kv1.4 mRNA is nearly uniformly expressed (E, E1, and E2), but Kv1.4 protein is mainly expressed in apical LV endo and septum and is essentially absent from LV epi and RV. (F3–F5, H3–H5, and J3– J5) Relative fluorescent intensity profiles of Kv1.4 antibody (F3–F5), Kv4.2 antibody (H3–H5), and Kv4.3 antibody (J3–J5) measured transversely from the indicated basal, midventricular, and apical regions (cyan lines 3–5, respectively, in F, H, and J). For comparative purposes, the relative fluorescent intensity values for each α subunit protein were normalized to the relative maximum fluorescence obtained for that given α subunit (i.e., maximum relative intensity, 100%; minimum; 0%; see methods). Please note the marked variations in relative intensity profiles measured from each transverse section.
Figure 6
Figure 6
Representative selected examples of IF of Kv4.2 (C1–C6), Kv4.3 (D1–D6), and Kv1.4 (E1–E6) α subunit protein expression in successive optical z sections of myocytes isolated from ferret LV epi (C and D; green, FITC) and LV endo (E; red, tetramethyl rhodamine thiocarbamoyl) regions. For controls, dioctadecyl 3,3,3′,3′ tetramethyl indocarbo cyanine (DiIC18; A1–A6; orange) and propidium iodide (B1–B6, red) were used as markers to label the sarcolemmal membrane and nucleus, respectively. Digitized fluorescent images were obtained using confocal microscopy of 1-μm thick optical z sections successively taken through the width of each myocyte; every third section is shown. Note (a) the localization of fluorescence to the sarcolemmal regions for DiIC18 and the three antibodies, and (b) the absence of fluorescence in the nuclei for all three antibodies. See text and Table II for further details.
Figure 8
Figure 8
Ferret ventricular sagittal section analysis: colocalization and distribution of Kv1.4, Kv4.2, and Kv4.3 α subunit proteins determined using direct IF. Representative colocalization data obtained from adjacent (7-μm thick) sections. AO, aorta; CA, coronary artery; Sep, septum. (A) Kv1.4 (red) + Kv4.2 (green) colocalized (yellow to orange) mainly in the apical LV endo and septum. (B) Kv1.4 (red) + Kv4.3 (green) also colocalized (yellow to orange) mainly in the apical LV epi and septum; however, there were also relatively more dispersed regions of colocalization in the basal LV and septal regions. (C) Kv4.2 (green) + Kv4.3 (red) displayed relatively marked colocalization (yellow to red) in the apex, LV endo, and the basal region of the LV, while there was relatively little colocalization in the apical region of the RV. (D) Overall distribution patterns of Kv1.4 (blue), Kv4.2 (green), and Kv4.3 (red) α subunit proteins. Colocalization of Kv4.2 + Kv4.3, yellow to orange; Kv1.4 + Kv4.3, purple to pink.
Figure 1
Figure 1
Representative examples of Ito phenotypes in ferret LV epi (A) and LV endo (B) myocytes. Currents elicited in response to either (A) 500- or (B) 1,000-ms voltage-clamp step pulses applied from a HP of −70 mV to the indicated potentials (10-mV increments). Pulse frequency: (A) LV epi, 0.167 Hz; (B) LV endo, 0.05 Hz. (C1) Comparison of mean current density–voltage (I–V) relationships for both Ito phenotypes (−60 to +70 mV) and the inwardly rectifying K+ current, IK1 (−80 to −120 mV), in ferret LV epi (○) and LV endo (♦) myocytes. Currents elicited in response to either 500- (LV epi) or 1,000-ms (LV endo) depolarizing voltage-clamp steps applied from a HP of −70 mV. Pulse frequency: LV endo, 0.167 Hz; LV epi, 0.05 Hz. Ito was defined as: Ito,epi = Ipeak − I500 ms; Ito,endo = Ipeak − I1000 ms. Data points for IK1 correspond to the peak inward current in response to 500-ms hyperpolarizing voltage clamp pulses applied from −80 to −120 mV. Data points mean values of: LV epi Ito and IK1, seven myocytes; LV endo Ito (−60 to +70 mV), seven myocytes; and LV endo IK1 (−80 to −120 mV), six myocytes. (C2) Mean LV endo I–V relationship plotted on an expanded scale.
Figure 2
Figure 2
(A) Mean steady state inactivation relationships for Ito phenotypes in ferret LV epi and LV endo myocytes. Voltage-clamp protocol illustrated in inset: HP of −70 mV; P1, indicated potentials for either 500 (LV epi, ▴) or 1,000 ms (LV epi, ○; LV endo, •); P2, +50 mV for either 500 or 1,000 ms. Pulse protocol frequency: LV epi, 0.167 Hz; LV endo, 0.05 Hz. Inactivation curves were constructed by normalizing the control P2 Ito amplitude (i.e., peak Ito at +50 mV with no P1 prepulse) with respect to each P2 Ito after a P1 prepulse to the indicated potentials (−100 to +50 mV). Mean data points (LV epi, seven myocytes for P1 = 500 ms; nine myocytes for P1 = 1,000 ms; LV endo, eight myocytes) have been fit with single Boltzmann relationships with the following parameters: LV epi (for P1 = 500 and 1,000 ms), V1/2 = −9 mV, k = 5.45 mV; LV endo, V1/2 = −34 mV, k = 8.05 mV. (B) Representative examples of fully activated Ito macroscopic inactivation kinetics at +50 mV. Representative Ito waveforms from an LV epi and LV endo myocyte have been overlaid and their relative peaks normalized for ease of comparison. Ito,epi fit with a single exponential with τ = 70.3 ms; Ito,endo fit with two exponentials, with τ1 = 101.1 ms, τ2 = 552.8 ms, ratio of initial amplitudes A1/(A1 + A2) = 0.535. (Inset) The mean (nine myocytes) time constants of Ito,epi macroscopic inactivation are essentially independent of voltage over the potential range where the current is fully activated; i.e., depolarized above approximately +20 mV.
Figure 3
Figure 3
Representative Ito phenotype recovery waveforms recorded from a ferret LV epi (A1) and LV endo (B1) myocyte. Double pulse recovery protocol (A2, inset): HP of −70 mV, P1 = P2 = +50 mV, 500 ms for LV epi, 500 or 1,000 ms for LV endo). Please note the difference in time scales. Pulse protocol frequency: LV epi, 0.125 Hz; LV endo, 0.05 Hz. Individual recovery waveforms fit with single exponentials with indicated time constants. Summarized mean kinetics of recovery from inactivation at a HP of −70 mV for LV epi myocytes (A2, n = 7) and LV endo myocytes (A2, n = 8; data points at any given interpulse interval Δt correspond to mean values from three to eight myocytes). Recovery curves were constructed by taking the ratio of (P2 Ito)/(P1 Ito) as a function of interpulse interval Δt. For comparative purposes, and to account for variability in degree of incomplete inactivation of LV endo Ito at the end of the P1 pulse, the pooled LV endo (P2 Ito/P1 Ito) current ratios were renormalized with respect to initial and final Δt values (Rasmusson et al., 1995a). Mean recovery curves fit as single exponentials: LV epi, τ = 48 ms; LV endo, τ = 2,441 ms. (C1 and C2) Representative examples of frequency-dependent LV Ito,epi versus Ito,endo gating behavior to 50- (C1) and 100-ms (C2) depolarizing pulse trains applied to +50 mV at a frequency of 5 Hz from a HP of −70 mV. Peak currents have been normalized for illustrative purposes. Note that cumulative inactivation is pronounced in Ito,endo but is absent (50 ms pulse, C1) to minimal (100 ms pulse, C2) in Ito,epi. Similar results were observed in four LV epi and four LV endo myocytes.
Figure 4
Figure 4
Blocking effects of HPTX2. (A) Voltage dependence of block of ferret LV Ito,epi by 150 nM HPTX2. Mean data from three LV epi myocytes. For illustrative purposes, peak Ito,epi amplitudes have been normalized to their control peak value at +70 mV. HPTX2 reversibly blocked Ito,epi without any significant effects on the sustained noninactivating current remaining at 500 ms. (Inset) Ito,epi waveforms before (solid lines) and after (dashed lines) 150 nM HPTX2 (+10, +30, +50, and +70 mV; HP, −70 mV; frequency, 0.125 Hz). (B) Potential dependence of HPTX2 block of peak LV Ito,epi. Mean data over the potential range +10 to +70 mV obtained from the same three myocytes in A. Data fit: percent block peak Ito,epi = 92.4911 exp(−0.02096[mV])%. (Inset) Points: derived apparent K ds calculated from mean data points in B assuming a saturable simple single binding site model. Fit: K d,V = 54.944 exp(0.03382[mV]) nM. (C) 150 nM HPTX2 does not produce any significant block of the major slowly recovering Ito phenotype in ferret LV endo myocytes. Representative recording from a ferret LV endo myocyte. Each data point corresponds to the peak Ito,endo elicited during a 1,000-ms voltage clamp pulse to +50 mV (HP, −70 mV; frequency, 0.05 Hz). Numbered data points correspond to representative currents illustrated in inset. Calibration bars: 150 pA, 200 ms. In contrast to its rapid blocking effects on Ito,epi, 150 nM HPTX2 failed to produce any significant block of Ito,endo during a perfusion period of ∼7 min.
Figure 4
Figure 4
Blocking effects of HPTX2. (A) Voltage dependence of block of ferret LV Ito,epi by 150 nM HPTX2. Mean data from three LV epi myocytes. For illustrative purposes, peak Ito,epi amplitudes have been normalized to their control peak value at +70 mV. HPTX2 reversibly blocked Ito,epi without any significant effects on the sustained noninactivating current remaining at 500 ms. (Inset) Ito,epi waveforms before (solid lines) and after (dashed lines) 150 nM HPTX2 (+10, +30, +50, and +70 mV; HP, −70 mV; frequency, 0.125 Hz). (B) Potential dependence of HPTX2 block of peak LV Ito,epi. Mean data over the potential range +10 to +70 mV obtained from the same three myocytes in A. Data fit: percent block peak Ito,epi = 92.4911 exp(−0.02096[mV])%. (Inset) Points: derived apparent K ds calculated from mean data points in B assuming a saturable simple single binding site model. Fit: K d,V = 54.944 exp(0.03382[mV]) nM. (C) 150 nM HPTX2 does not produce any significant block of the major slowly recovering Ito phenotype in ferret LV endo myocytes. Representative recording from a ferret LV endo myocyte. Each data point corresponds to the peak Ito,endo elicited during a 1,000-ms voltage clamp pulse to +50 mV (HP, −70 mV; frequency, 0.05 Hz). Numbered data points correspond to representative currents illustrated in inset. Calibration bars: 150 pA, 200 ms. In contrast to its rapid blocking effects on Ito,epi, 150 nM HPTX2 failed to produce any significant block of Ito,endo during a perfusion period of ∼7 min.
Figure 5
Figure 5
Antibody specificity. (A–I) Specificity of the anti– Kv4.2 and –Kv4.3 antibodies determined by immunofluorescent measurements on transfected Xenopus oocytes. (A) Bright field micrograph of a bisected oocyte. (B and C) Sham-transfected oocytes tested with Kv4.2 (B) and Kv4.3 (C) antibodies. (D–F) Specificity of Kv4.2 antibody. Oocytes injected with Kv4.2 mRNA and subsequently tested with Kv4.2 (D), Kv4.3 (E), and Kv4.2 (F) antibody after preabsorption of the oocytes with Kv4.3 antibody. (G–I) Specificity of Kv4.3 antibody. Oocytes injected with Kv4.3 mRNA and subsequently tested with Kv4.3 (G), Kv4.2 (H), and Kv4.3 (I) antibody after preabsorption with Kv4.2 antibody. (J–L) Expression patterns of Kv1.4 (J), Kv4.2 (K), and Kv4.3 (L) determined by immunoblot analysis of proteins isolated from the whole tissue homogenate plus cytosolic, particulate, and sarcolemma membrane-enriched fractions prepared from ferret LV epi and LV endo regions. Fractionated proteins on PVDF membranes were immunoblotted using antibodies for Kv1.4 (1:2,000), Kv4.2 (1:500), and Kv4.3 (1:200). The bound antibodies were then detected using chemiluminescence as described by the manufacturer (Amersham Corp.). Markers are shown in J, lane 1, and immunoblot analysis results using Kv1.4, Kv4.2, and Kv4.3 antibodies on LV epi (J–L, lane 2) and LV endo (J–L, lane 3) sarcolemmal membrane–enriched fractions, LV epi (J–L, lane 4) and LV endo (J–L, lane 5) cytosolic-enriched fractions, LV epi (J–L, lane 6) and LV endo (J–L, lane 7) particulate-enriched fractions, and LV epi (J–L, lane 8) and LV endo (J–L, lane 9) whole-tissue homogenates are shown. In particular, in the sarcolemmal membrane–enriched fractions (J–L, lanes 2 and 3), please note the following antibody-binding patterns: (a) Kv1.4 antibody: a single band at 95–100 kD was obtained from protein prepared from the LV endo region (J, lane 3), but was absent from the LV epi region preparation (J, lane 2); (b) Kv4.2 antibody: a single band at ∼70–75 kD was obtained from protein prepared from both the LV epi (K, lane 2) and LV endo (K, lane 3) regions, but was more prominent in the LV epi preparation; and (c) Kv4.3 antibody: an intense single band at ∼75 kD was obtained from protein prepared from both LV epi (L, lane 2) and LV endo (L, lane 3) regions and was of similar intensity in both preparations.

References

    1. Aldrich RW. Inactivation of voltage-gated delayed potassium current in molluscan neurons. A kinetic model. Biophys J. 1981;36:519–532. - PMC - PubMed
    1. Amos GJ, Wettwer E, Metzger F, Li Q, Himmel HM, Ravens U. Differences between outward currents of human atrial and subepicardial ventricular myocytes. J Physiol (Camb) 1996;491:31–50. - PMC - PubMed
    1. Antzelevitch, C., S. Sicouri, A. Lukas, V.V. Nesterenko, D.-W. Liu, and J. Di Diego. 1995. Regional differences in the electrophysiology of ventricular cells: physiological and clinical implications. In Cardiac Electrophysiology. From Cell to Bedside. 2nd ed. D. Zipes and J. Jalife, editors. W.B. Saunders Co., Philadelphia. 228–245.
    1. Barry DM, Nerbonne JM. Myocardial potassium channels: electrophysiological and molecular diversity. Annu Rev Physiol. 1996;58:363–394. - PubMed
    1. Barry DM, Trimmer JS, Merlie JP, Nerbonne JM. Differential expression of voltage-gated K+ channel subunits in adult rat heart: relationship to functional K+ channels? . Circ Res. 1995;77:361–369. - PubMed

Publication types

MeSH terms

Substances