

Bacterivory rate estimates and fraction of active bacterivores in natural protist assemblages from aquatic systems
- PMID: 10103238
- PMCID: PMC91208
- DOI: 10.1128/AEM.65.4.1463-1469.1999
Bacterivory rate estimates and fraction of active bacterivores in natural protist assemblages from aquatic systems
Abstract
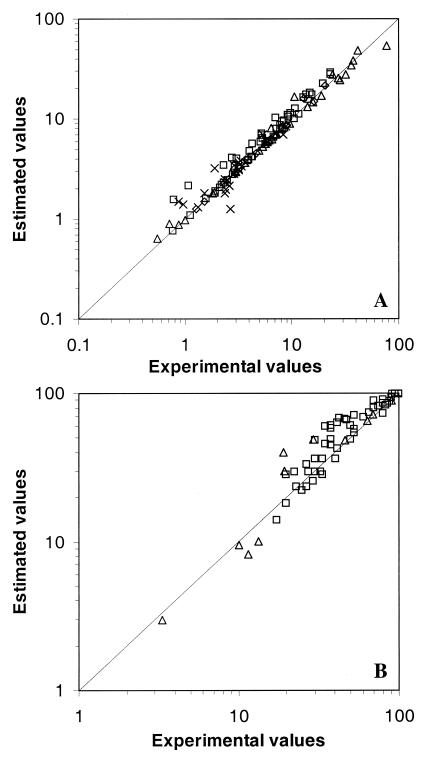
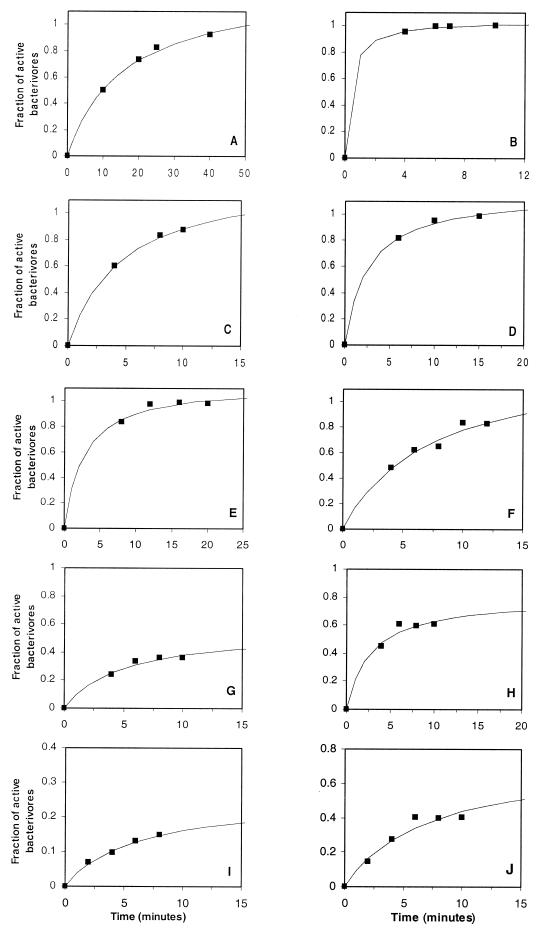
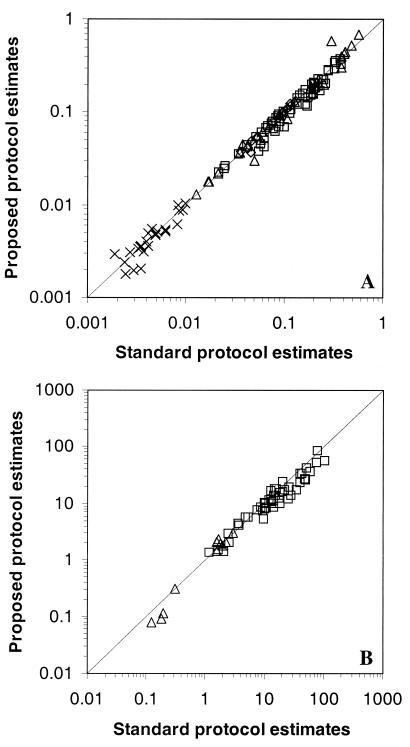
Unlike the fraction of active bacterioplankton, the fraction of active bacterivores (i.e., those involved in grazing) during a specified time period has not been studied yet. Fractions of protists actively involved in bacterivory were estimated assuming that the distributions of bacteria and fluorescently labeled bacteria (FLB) ingested by protists follow Poisson distributions. Estimates were compared with experimental data obtained from FLB uptake experiments. The percentages of protists with ingested FLB (experimental) and the estimates obtained from Poisson distributions were similar for both flagellates and ciliates. Thus, the fraction of protists actively grazing on natural bacteria during a given time period could be estimated. The fraction of protists with ingested bacteria depends on the incubation time and reaches a saturating value. Aquatic systems with very different characteristics were analyzed; estimates of the fraction of protists actively grazing on bacteria ranged from 7 to 100% in the studied samples. Some nanoflagellates appeared to be grazing on specific bacterial sizes. Evidence indicated that there was no discrimination for or against bacterial surrogates (i.e., FLB); also, bacteria were randomly encountered by bacterivorous protists during these short-term uptake experiments. These analyses made it possible to estimate the ingestion rates from FLB uptake experiments by counting the number of flagellates containing ingested FLB. These results represent the first reported estimates of active bacterivores in natural aquatic systems; also, a proposed protocol for estimating in situ ingestion rates by protists represents a significant improvement and simplification to the current protocol and avoids the tedious work of counting the number of ingested FLB per protist.
Figures
Similar articles
-
Use of monodispersed, fluorescently labeled bacteria to estimate in situ protozoan bacterivory.Appl Environ Microbiol. 1987 May;53(5):958-65. doi: 10.1128/aem.53.5.958-965.1987. Appl Environ Microbiol. 1987. PMID: 16347355 Free PMC article.
-
Size-selective grazing of coastal bacterioplankton by natural assemblages of pigmented flagellates, colorless flagellates, and ciliates.Microb Ecol. 1992 May;23(3):211-25. doi: 10.1007/BF00164097. Microb Ecol. 1992. PMID: 24192932
-
Size-selective grazing on bacteria by natural assemblages of estuarine flagellates and ciliates.Appl Environ Microbiol. 1990 Mar;56(3):583-9. doi: 10.1128/aem.56.3.583-589.1990. Appl Environ Microbiol. 1990. PMID: 2107794 Free PMC article.
-
CARD-FISH in the Sequencing Era: Opening a New Universe of Protistan Ecology.Front Microbiol. 2021 Mar 4;12:640066. doi: 10.3389/fmicb.2021.640066. eCollection 2021. Front Microbiol. 2021. PMID: 33746931 Free PMC article. Review.
-
Predation as a shaping force for the phenotypic and genotypic composition of planktonic bacteria.Antonie Van Leeuwenhoek. 2002 Aug;81(1-4):413-34. doi: 10.1023/a:1020505204959. Antonie Van Leeuwenhoek. 2002. PMID: 12448740 Review.
Cited by
-
Protozoans bacterivory in a subtropical environment during a dry/cold and a rainy/warm season.Braz J Microbiol. 2014 May 19;45(1):143-51. doi: 10.1590/s1517-83822014000100020. eCollection 2014. Braz J Microbiol. 2014. PMID: 24948925 Free PMC article.
-
Pigmented nanoflagellates grazing on Synechococcus: seasonal variations and effect of flagellate size in the coastal ecosystem of subtropical Western Pacific.Microb Ecol. 2009 Oct;58(3):548-57. doi: 10.1007/s00248-009-9569-x. Epub 2009 Aug 5. Microb Ecol. 2009. PMID: 19655080
-
Development of a fatty acid and RNA stable isotope probing-based method for tracking protist grazing on bacteria in wastewater.Appl Environ Microbiol. 2010 Dec;76(24):8222-30. doi: 10.1128/AEM.01632-10. Epub 2010 Oct 29. Appl Environ Microbiol. 2010. PMID: 21037308 Free PMC article.
-
Behavior of an Aeromonas hydrophila aroA live vaccine in water microcosms.Appl Environ Microbiol. 2004 May;70(5):2702-8. doi: 10.1128/AEM.70.5.2702-2708.2004. Appl Environ Microbiol. 2004. PMID: 15128521 Free PMC article.
-
Mixotrophy in nanoflagellates across environmental gradients in the ocean.Proc Natl Acad Sci U S A. 2019 Mar 26;116(13):6211-6220. doi: 10.1073/pnas.1814860116. Epub 2019 Feb 13. Proc Natl Acad Sci U S A. 2019. PMID: 30760589 Free PMC article.
References
-
- Azam F, Fenchel T, Field J G, Gray J S, Meyer-Reil L A, Thingstad F. The ecological role of water-column microbes in the sea. Mar Ecol Prog Ser. 1983;10:257–263.
-
- Bird D F, Kalff J. Algal phagotrophy: regulating factors and importance relative to photosynthesis in dinobryon (chrysophyceae) Limnol Oceanogr. 1987;32:277–284.
-
- Cármenes R S. LSTSQ: a module for reliable constrained and unconstrained nonlinear regression. Comput Appl Biosci. 1991;7:373–378. - PubMed
-
- Cole J J, Findlay S, Pace M L. Bacterial production in fresh and saltwater ecosystem: a cross-system overview. Mar Ecol Prog Ser. 1988;43:1–10.
LinkOut - more resources
Full Text Sources
