

National health expenditures, 1995
Health Care Financ Rev.
1996 Fall.
Abstract
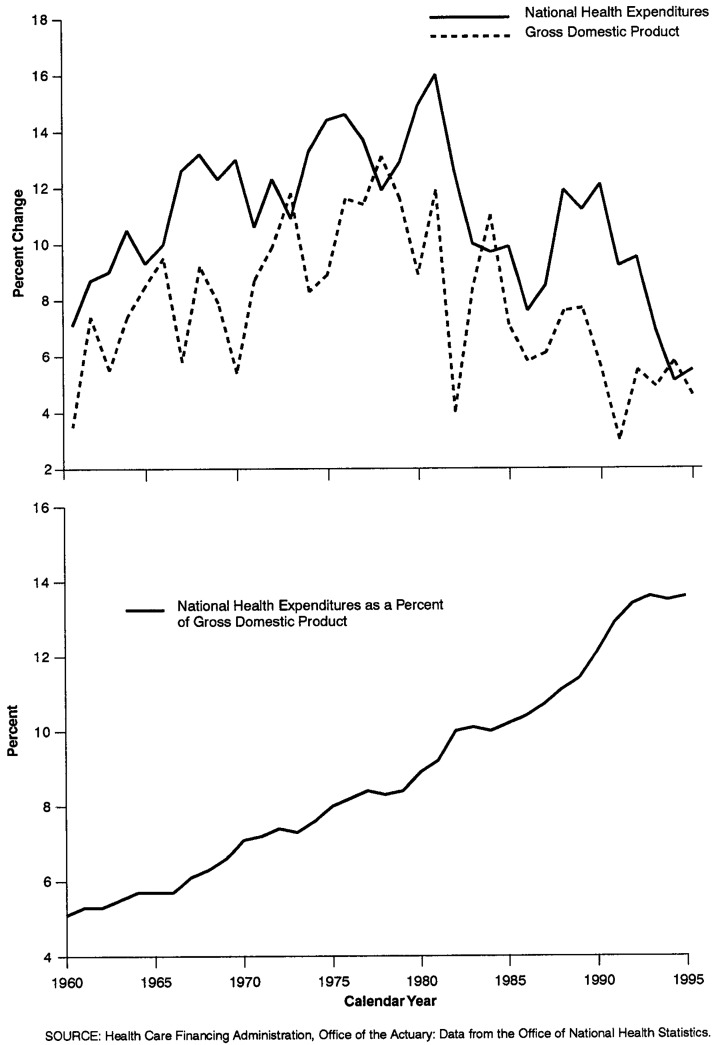
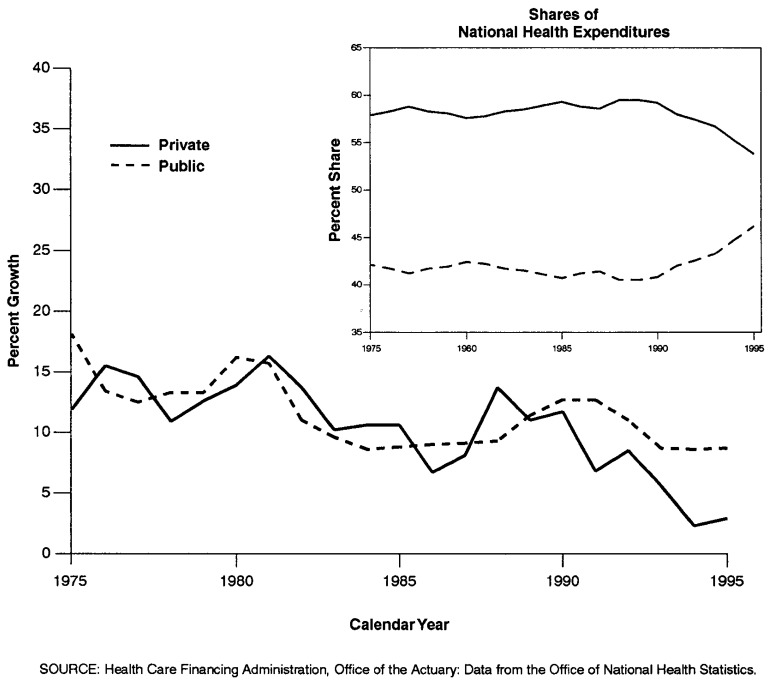
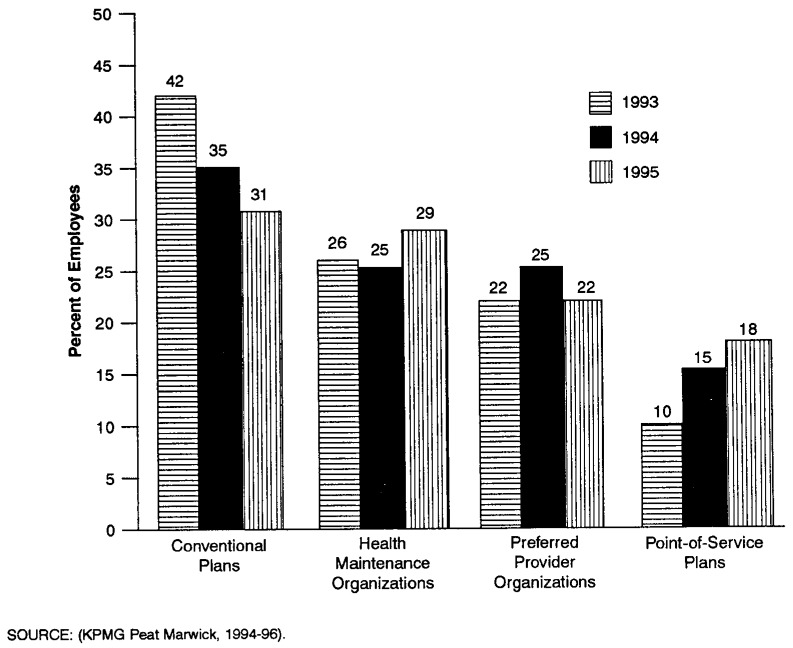
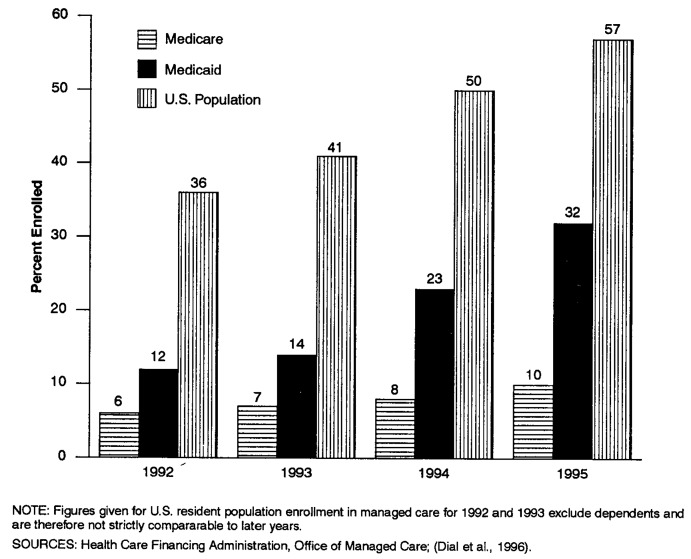
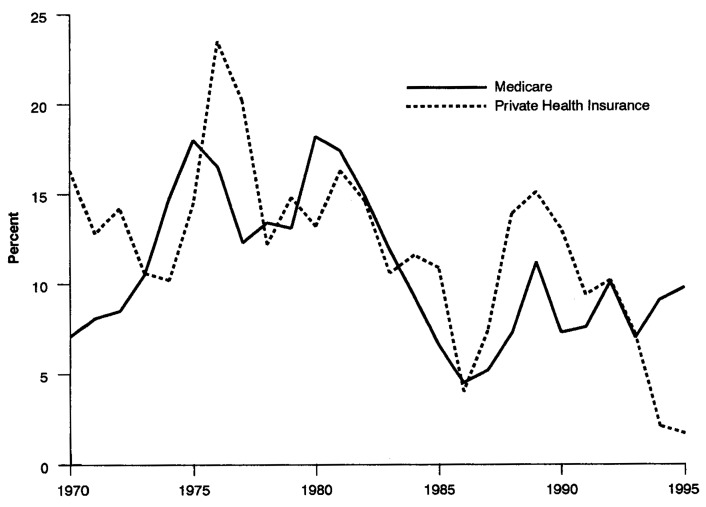
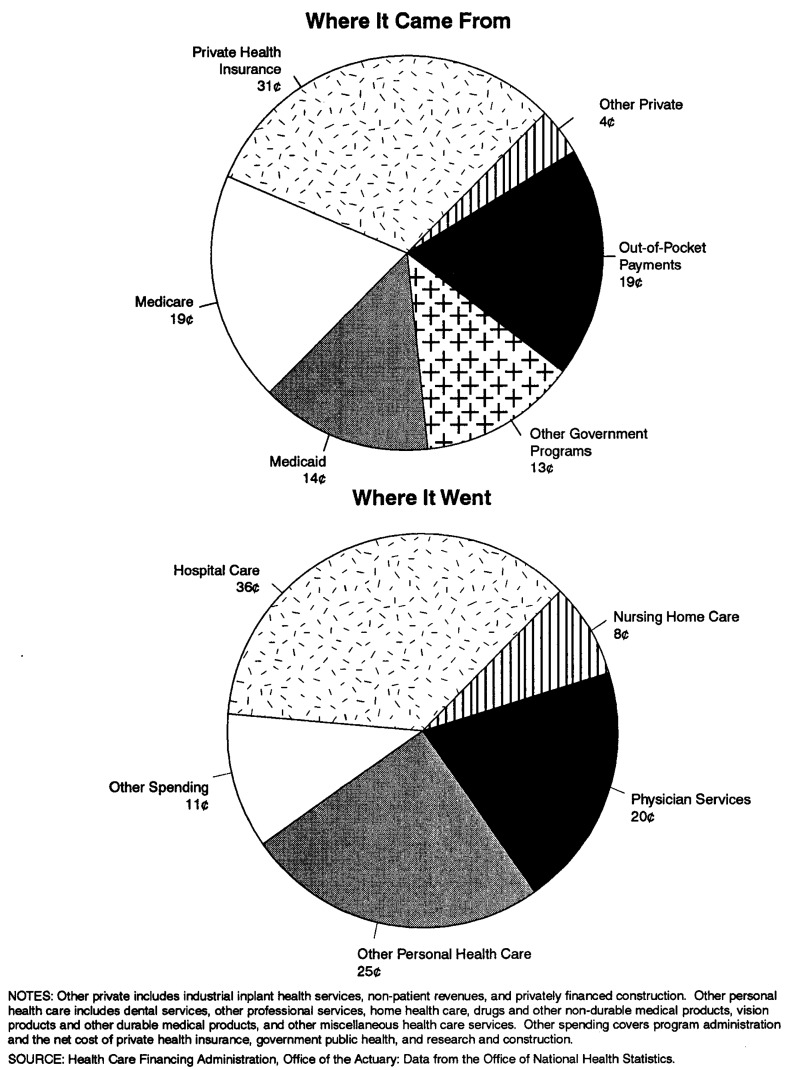
This article presents data on health care spending for the United States, covering expenditures for various types of medical services and products and their sources of funding from 1960 to 1995. In 1995, $988.5 billion was spent to purchase health care in the United States, up 5.5 percent from 1994. Growth in spending between 1993 and 1995 was the slowest in more than three decades, primarily because of slow growth in private health insurance and out-of-pocket spending. As a result, the share of health spending funded by private sources fell, reflecting the influence of increased enrollment in managed care plans.
Figures
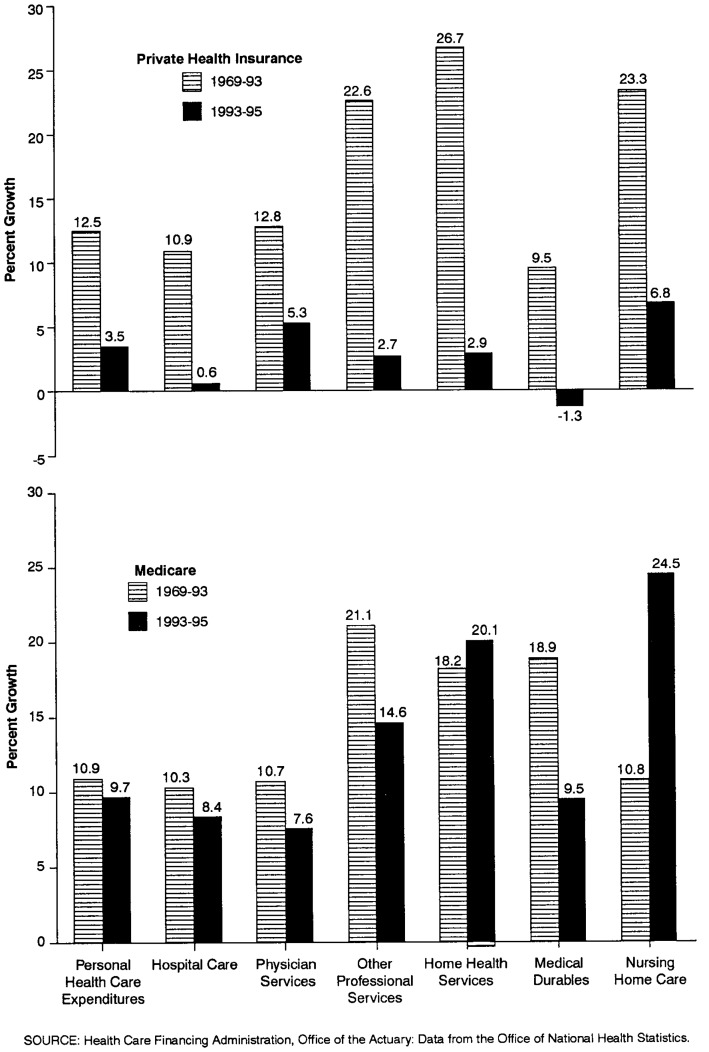
1Expenditures include benefits and administration for Medicare and benefits and net cost of insurance for private health insurance. SOURCE: Health Care Financing Administration, Office of the Actuary: Data from the Office of National Health Statistics.
References
-
- Alecxih LMB, Lutzky S. How Do Alternative Eligibility Triggers Affect Access to Private Long-Term Care Insurance? Washington, DC: American Association of Retired Persons; Aug, 1996. Public Policy Institute issue paper #9605.
-
- American Hospital Association. National Hospital Panel Survey. Chicago: 1995. Unpublished.
-
- American Medical Association. Socioeconomic Characteristics of Medical Practice, 1996. Chicago: Apr, 1996.
-
- Anders G. Pricey Operation: A Plan to Cut Back on Medicare Expenses Goes Awry; Costs Soar. The Wall Street Journal. 1996 Oct 3;:A1.
-
- Baker C, Kramer N. Employer Benefits Survey: A BLS Reader. Washington, DC.: U.S. Government Printing Office; Feb, 1995. Employer-Sponsored Prescription Drug Benefits. U.S. Department of Labor, Bureau of Labor Statistics. Bulletin 2459.
MeSH terms
LinkOut - more resources
Full Text Sources
Research Materials