Comparative Study
. 1999 Apr 5;145(1):1-14.
doi: 10.1083/jcb.145.1.1.

Evidence for a relatively random array of human chromosomes on the mitotic ring

Affiliations
Comparative Study

Evidence for a relatively random array of human chromosomes on the mitotic ring

D C Allison et al. J Cell Biol. .

Abstract

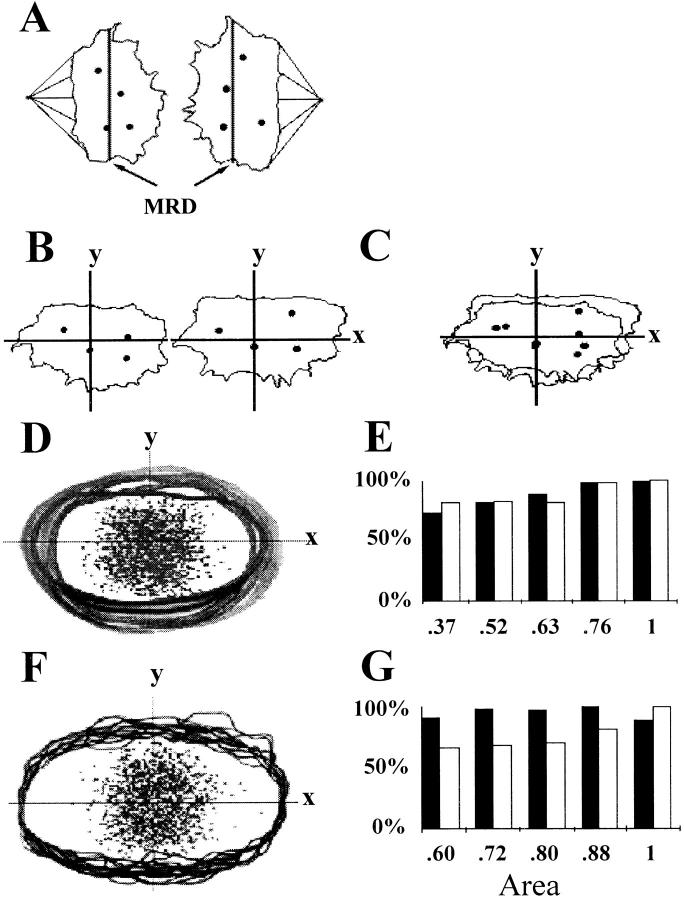
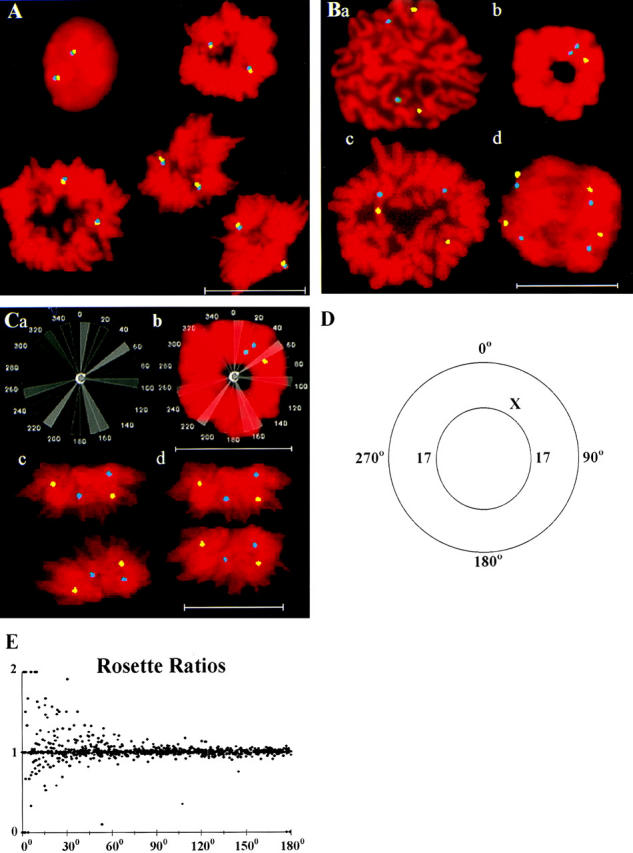
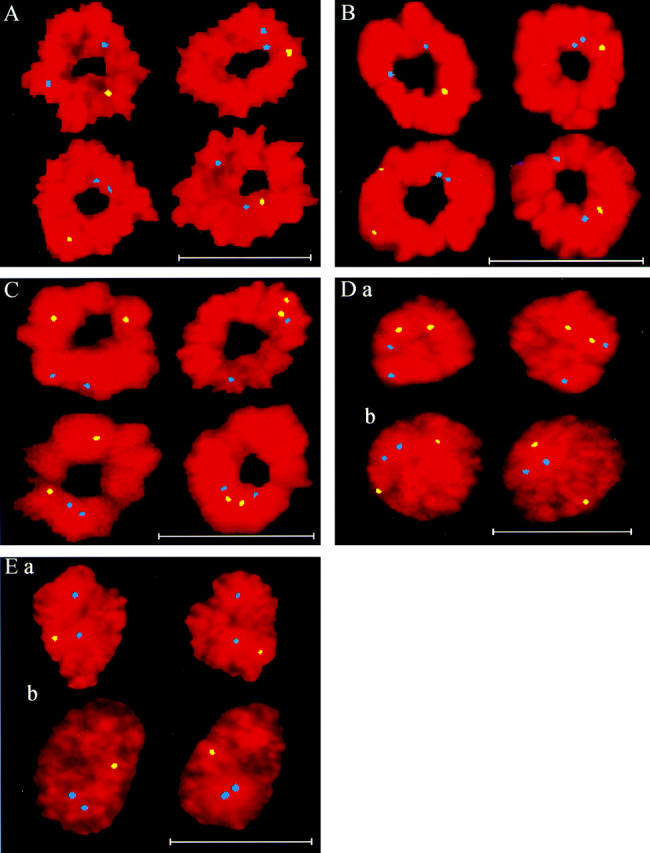
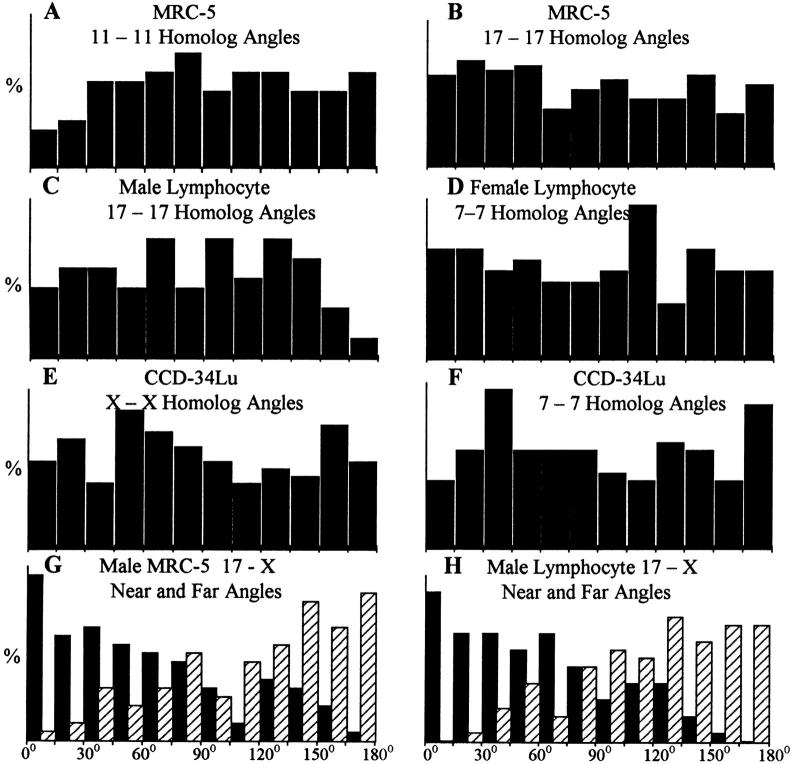
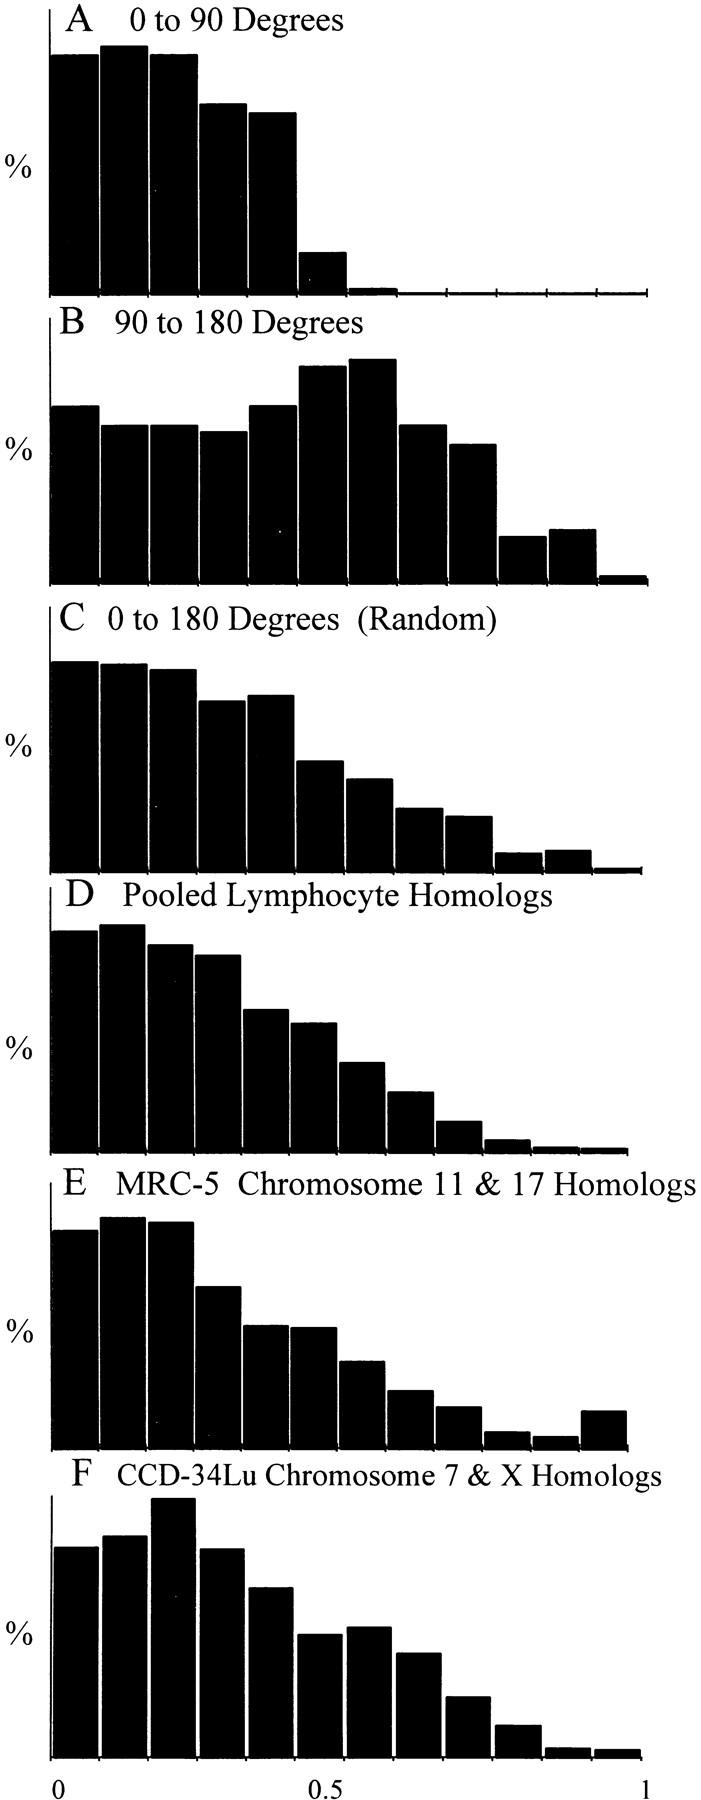
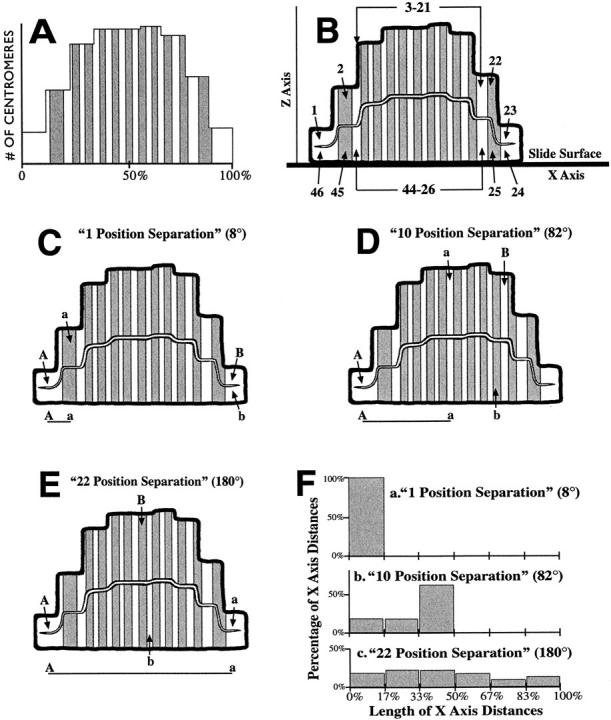
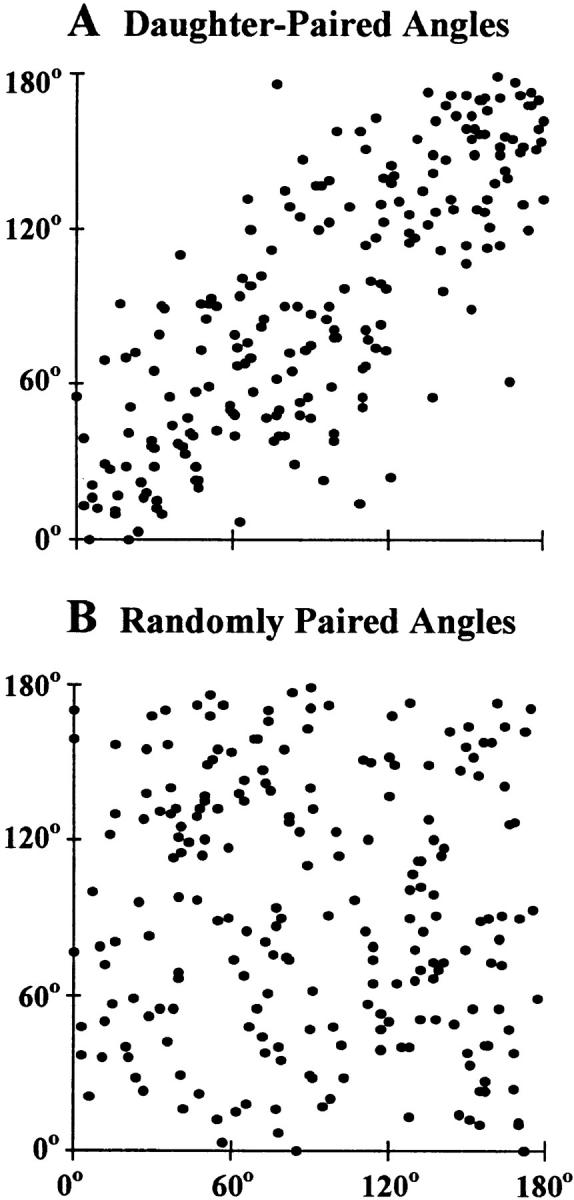
We used fluorescence in situ hybridization (FISH) to study the positions of human chromosomes on the mitotic rings of cultured human lymphocytes, MRC-5 fibroblasts, and CCD-34Lu fibroblasts. The homologous chromosomes of all three cell types had relatively random positions with respect to each other on the mitotic rings of prometaphase rosettes and anaphase cells. Also, the positions of the X and Y chromosomes, colocalized with the somatic homologues in male cells, were highly variable from one mitotic ring to another. Although random chromosomal positions were found in different pairs of CCD-34Lu and MRC-5 late-anaphases, the separations between the same homologous chromosomes in paired late-anaphase and telophase chromosomal masses were highly correlated. Thus, although some loose spatial associations of chromosomes secondary to interphase positioning may exist on the mitotic rings of some cells, a fixed order of human chromosomes and/or a rigorous separation of homologous chromosomes on the mitotic ring are not necessary for normal mitosis. Furthermore, the relative chromosomal positions on each individual metaphase plate are most likely carried through anaphase into telophase.


Figures

Figure 5
Figure 5
Coordinates for measuring chromosomal separations. (A) Anaphase from Fig. 1 C, panel c, showing the mitotic spindle apparatus and MRDs drawn through the mid-lateral edges of each chromosomal mass. Dots correspond to the centromere locations. (B) The MRDs of the chromosomal masses of A placed on the x-axis, with the y-axis coordinates in the right chromosomal mass image inverted so that all y-axis positive directions are toward the nuclear pole. The X, Y plane is parallel to the slide surface. (C) Composite in which the chromosomal masses of B are superimposed over each other. (D) Composite of the outer edges of 346 early and mid-anaphase lymphocyte chromosomal masses and 1,384 centromeric positions (dots). (E) Distances between the homologous chromosomes in five groups of chromosomal masses sorted by area: both the average X (black bars) and Y (white bars) distances between homologues increase with chromosomal mass area (correlation coefficients of 0.95 and 0.90, respectively). (F) Composite of the outer edges and centromeric positions of these chromosomal masses after the area of each chromosomal mass image has been adjusted to an identical MRD as in Fig. 1 C, panel d. (G) Relationship between chromosomal mass area and the interchromosomal distances after the area correction to an identical MRD. The x-axis distances are now independent of area (correlation coefficient = −0.11), whereas the y-axis measurements are still area dependent (correlation coefficient = 0.93).
Figure 1
Figure 1
(A) FISH-localized homologues of the X chromosomes in female human lymphocytes doubly hybridized with a FluorX-labeled whole chromosome paint probe (yellow) and a Spectrum orange–labeled centromeric probe (blue). The colocalization of both probes in interphase and mitotic cells is apparent. (B) FISH-localized homologues of MRC-5 chromosomes 11 (yellow) and 17 (blue) in prophase (a); the X (yellow) and 17 (blue) chromosomes in a prometaphase rosette (b); FISH-localized homologues of lymphocyte chromosomes 11 (yellow) and 17 (blue) in a metaphase with undivided centromeres (c); and an early anaphase (d). (C) A grid used to measure rosette chromosomal positions (a); placed over the rosette (b); a mid-anaphase cell with the separating chromosomal masses (c); and a transform of image c in which both mitotic rings are given an identical diameter set on the x-axis, with positive directions on the y-axis being toward the nuclear pole (d). (D) Male rosette with two homologues of chromosome 17 positioned at 90° and 270° and the X chromosome at 45°. (E) Ratios of two independent sets of measurements of angular separation between the same chromosomes in MRC-5 and lymphocyte rosettes (n = 1,011), showing increasing variability as the angular separations decrease. Bars, 20 μm.
Figure 2
Figure 2
(A) Male lymphocyte rosettes with the FISH-localized homologues of chromosome 17 (blue) and X (yellow) showing widely varying positions. (B) MRC-5 rosettes with the FISH-localized homologues of chromosome 17 (blue) and X (yellow) showing widely varying positions. (C) CCD-34Lu rosettes with the FISH-localized homologues of chromosomes X (yellow) and 7 (blue) showing widely varying positions. (D) CCD-34Lu late-anaphase (a) and telophase (b) pairs with the FISH-localized homologues of chromosomes X (yellow) and 7 (blue). (E) MRC-5 late-anaphase (a) and telophase (b) pairs with the FISH-localized homologues of chromosome 7 (yellow) and X (blue). Bars, 20 μm.
Figure 3
Figure 3
Angular separations of FISH-localized chromosomes in MRC-5, lymphocyte, and CCD-34Lu rosettes. (A) MRC-5 chromosome 11 homologues (n = 103). (B) MRC-5 chromosome 17 homologues (n = 203). (C) Male lymphocyte chromosome 17 homologues (n = 100). (D) Female lymphocyte chromosome 7 (n = 104). (E) CCD-34Lu chromosome X homologues (n = 156). (F) CCD-34Lu chromosome 7 homologues (n = 156). (G and H) Nearest (black bars) and farthest (striped bars) angular separations between the 17 homologues and the X chromosome in male MRC-5 rosettes (n = 100, G) and male lymphocyte rosettes (n = 100, H).
Figure 7
Figure 7
Theoretical and measured distributions of the x-axis distances between homologous chromosomes in early and mid-anaphases. (A–C) Theoretical models of the x-axis distance distributions for two chromosomes separated within the ranges of 0–90° (A), 90–180° (B), and 0–180° (random distribution, C). (D) Pooled x-axis distances between 5,304 homologous pairs of lymphocyte chromosomes 1–22, XX, and XY. (E) Pooled x-axis distances measured between 1,042 pairs of homologous MRC-5 chromosomes 11 and 17. (F) Pooled x-axis distances measured between 816 pairs of homologous CCD-34Lu chromosomes X and 7.
Figure 6
Figure 6
A scaling framework to reconstruct the x-axis distances between fixed anaphase chromosomes back to the native chromosomal sequence. (A) Distribution of the x-axis locations of 7,810 centromeres (2,154 MRC-5 cells and 5,656 lymphocytes) measured in chromosomal mass images aligned and transformed as in Fig. 1 C, panel d. The 23 light and shaded intervals each contain an identical number of centromeres. There are relatively fewer centromeres at either end of the x-axis (toward 0% or 100%) where the fixed mitotic ring edges stretch to meet the slide surface. (B) Panel A drawn as a fixation-distorted mitotic ring viewed in the Z, X plane: the z-axis is perpendicular to the slide surface with the x-axis through the MRD. B defines the x-axis locations of an upper set of chromosomes (labeled 1–23) farthest from the slide surface on the z-axis, and a bottom set of chromosomal locations (24–46) adjacent to the slide surface. The x-axis slide location of each individual upper-set chromosome is superimposed over that of a mirror-image chromosome of the bottom set. (C–E) Views of three mitotic rings fixed to the slide surface through the Z, X plane. Each panel shows the positions of two pairs of chromosomes with the same separation in the native mitotic ring, but fixed in different ring positions on the slide to produce maximum (labeled A and a) and minimum (labeled B and b) x-axis distances between them. (C) 1 position separation (8°) on the native mitotic ring. (D) 10 position separation (82°). (E) 22 position separation (180°). The A-a, or maximum, x-axis distances possible for each pair of chromosomes are also shown beneath each panel. (F) Theoretical distributions for the x-axis distances for two chromosomes with 1 position (8°, panel a), 10 position (82°, panel b), and 22 position (180°, panel c) of separation in the native mitotic ring.
Figure 4
Figure 4
Correlation of the angles between the homologues of CCD-34Lu chromosomes X and 7 and MRC-5 chromosome 7 consecutively measured in 142 widely separated pairs of CCD-34Lu (n = 72) and MRC-5 (n = 70) chromosomal masses (214 pairs of angular measurements compared). The y-axis coordinate of each point plotted is the angle measured between a pair of homologues in one chromosomal mass with the x-axis coordinate being either the same angle measured in the other chromosomal mass of a pair (daughter-paired) or a randomly selected, nondaughter chromosomal mass of the same cell type (randomly paired). It can be seen that the daughter-paired measurements (A) are highly correlated (correlation coefficient = 0.788), whereas the randomly paired measurements (B) are not correlated (correlation coefficient = −0.087).

References

    1. Bajer A, Molè-Bajer J. Cine-micrographic studies of mitosis in endosperm. II. Chromosome cytoplasmic and Brownian movements. Chromosoma. 1956;7:558–607.
    1. Bajer, A.S., and J. Molè-Bajer. 1981. Mitoses: studies of living cells: a revision of basic concepts. In Mitoses/Cytokineses. A.M. Zimmerman and A. Forer, editors, Academic Press, New York. 227–299.
    1. Barr ML, Bertram EG. A morphological distinction between neurons of the male and female, and the behavior of the nucleolar satellite during accelerated nucleoprotein synthesis. Nature. 1949;163:676–677. - PubMed
    1. Borden J, Manuelidis L. Movement of the X chromosome in epilepsy. Science. 1988;242:1687–1691. - PubMed
    1. Boveri T. Die Blastomerenkerne von Ascaris megalocephala und die Theorie der Chromosomenindividualität. Arch Zellforschung. 1909;3:181–268.

Publication types