. 1999 Apr 15;19(8):3146-61.
doi: 10.1523/JNEUROSCI.19-08-03146.1999.

Axons from anteroventral cochlear nucleus that terminate in medial superior olive of cat: observations related to delay lines

Affiliations

Axons from anteroventral cochlear nucleus that terminate in medial superior olive of cat: observations related to delay lines

G E Beckius et al. J Neurosci. .

Abstract

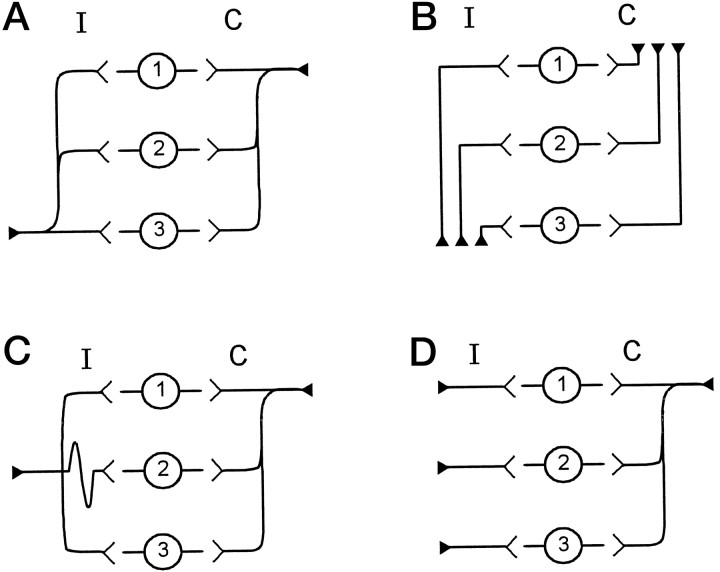
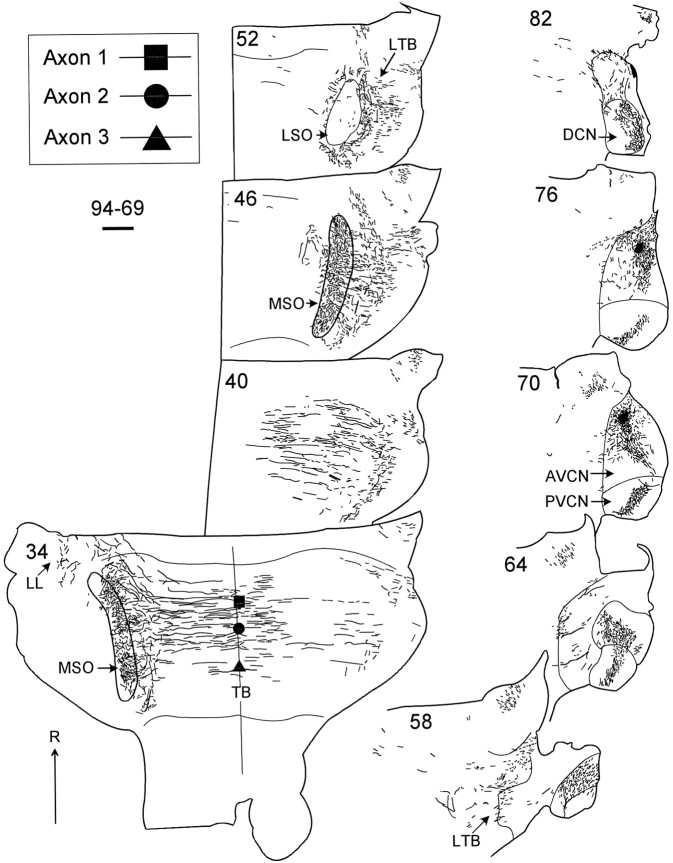
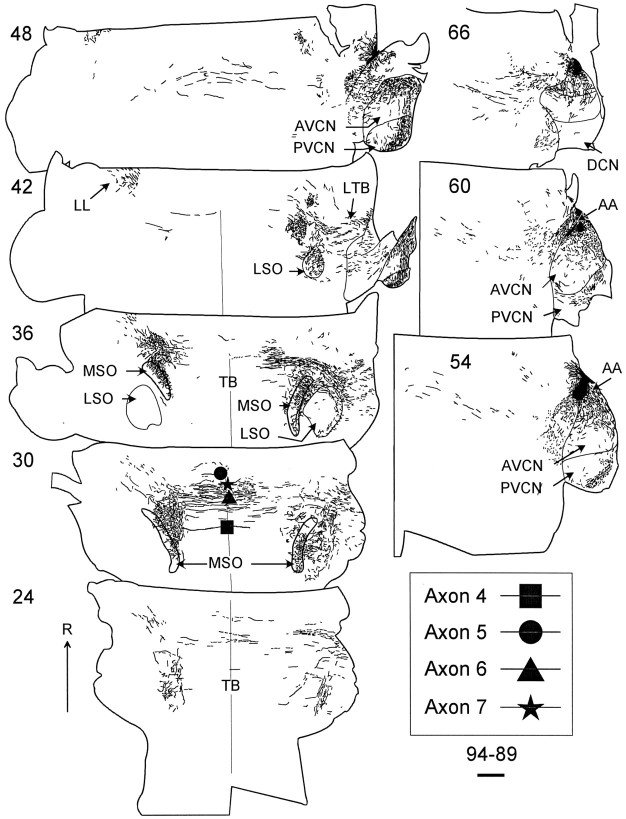
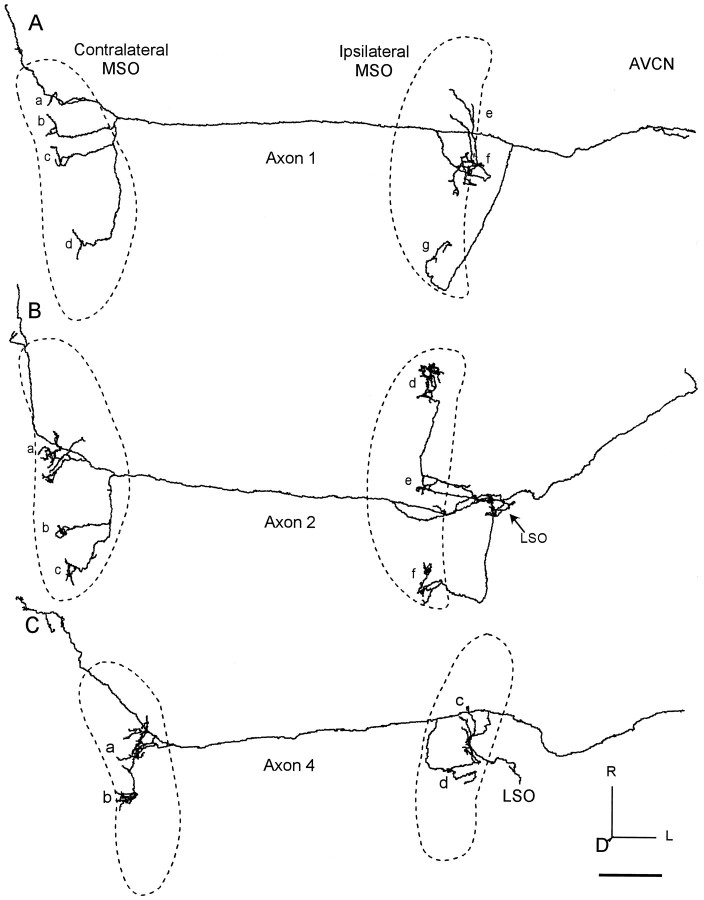
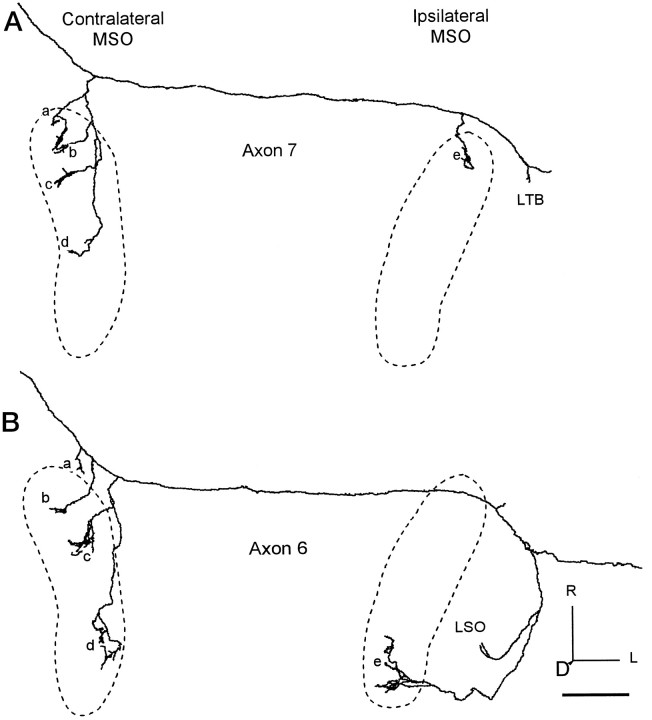
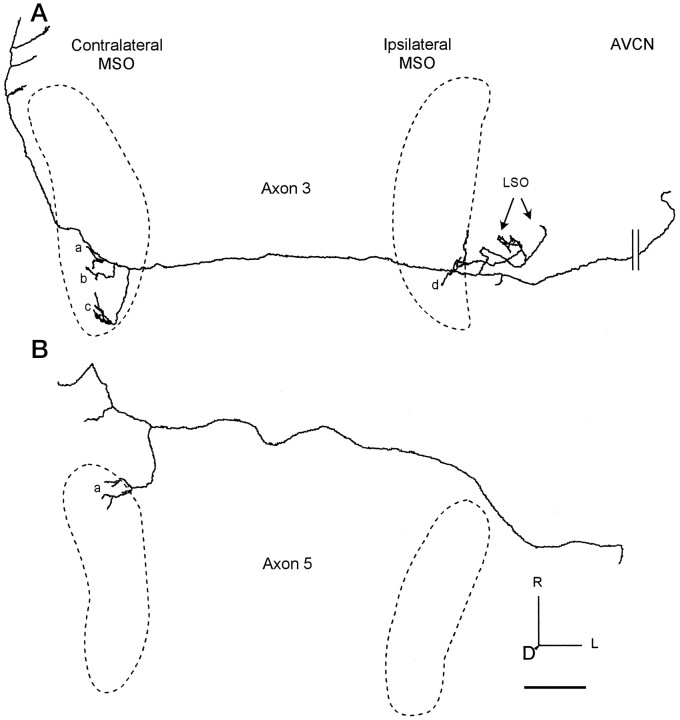
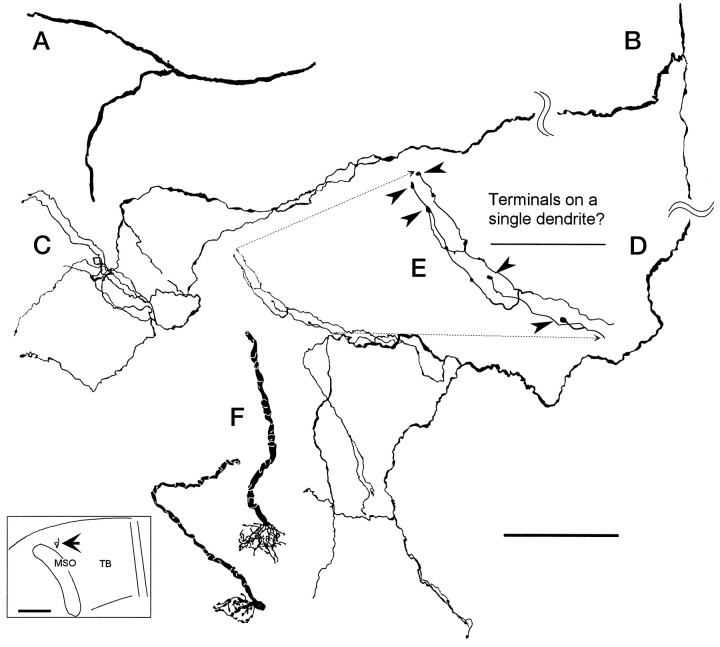
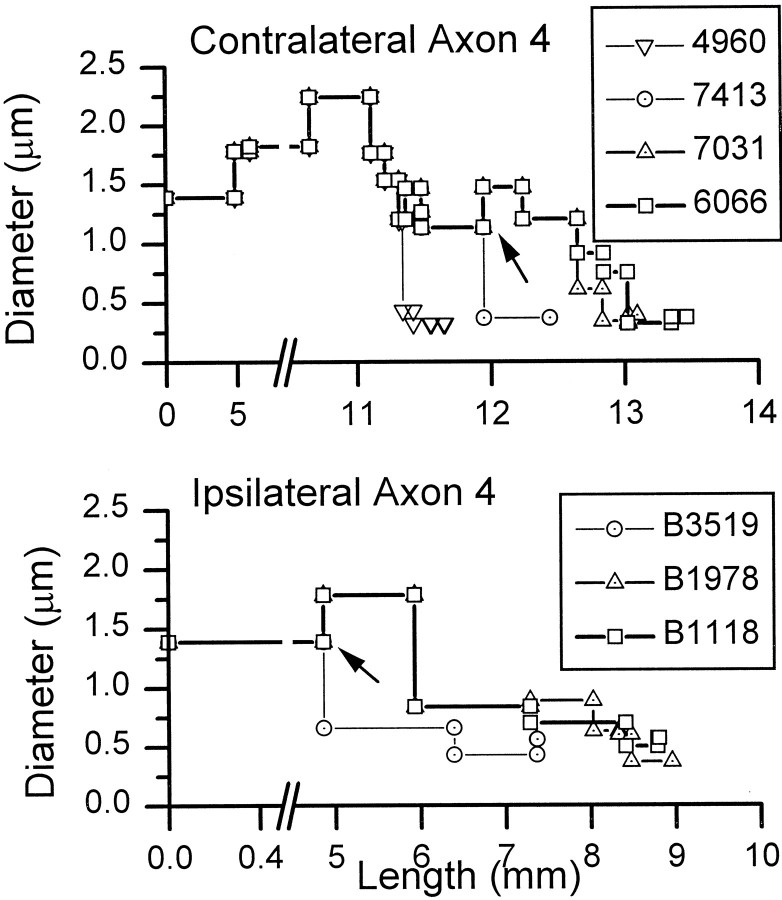
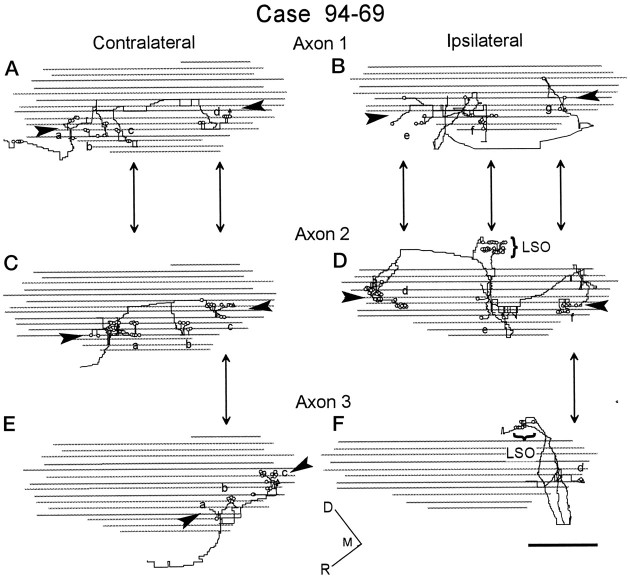
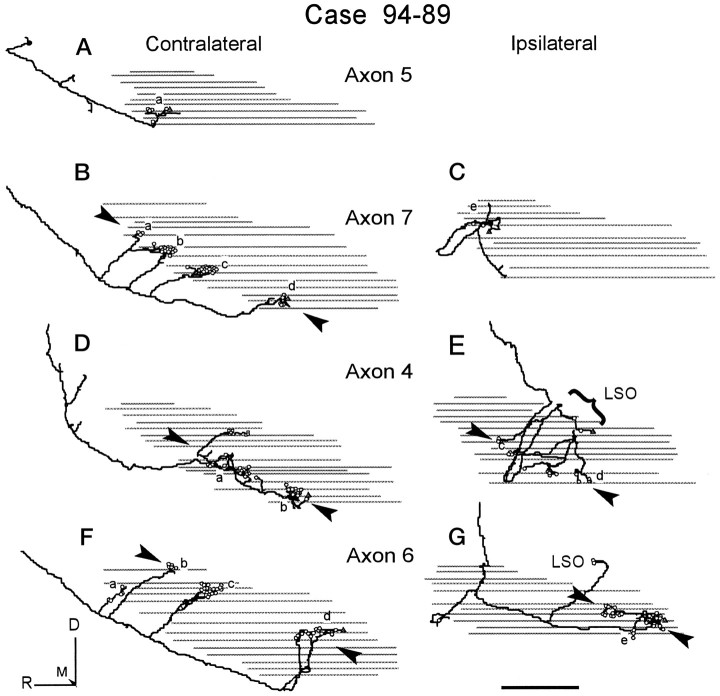
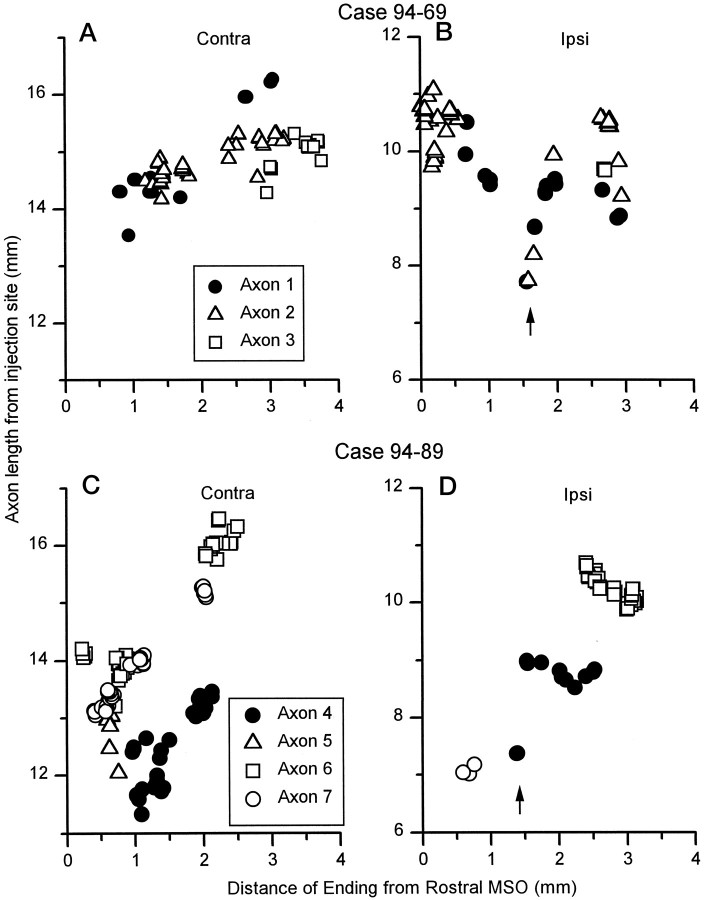
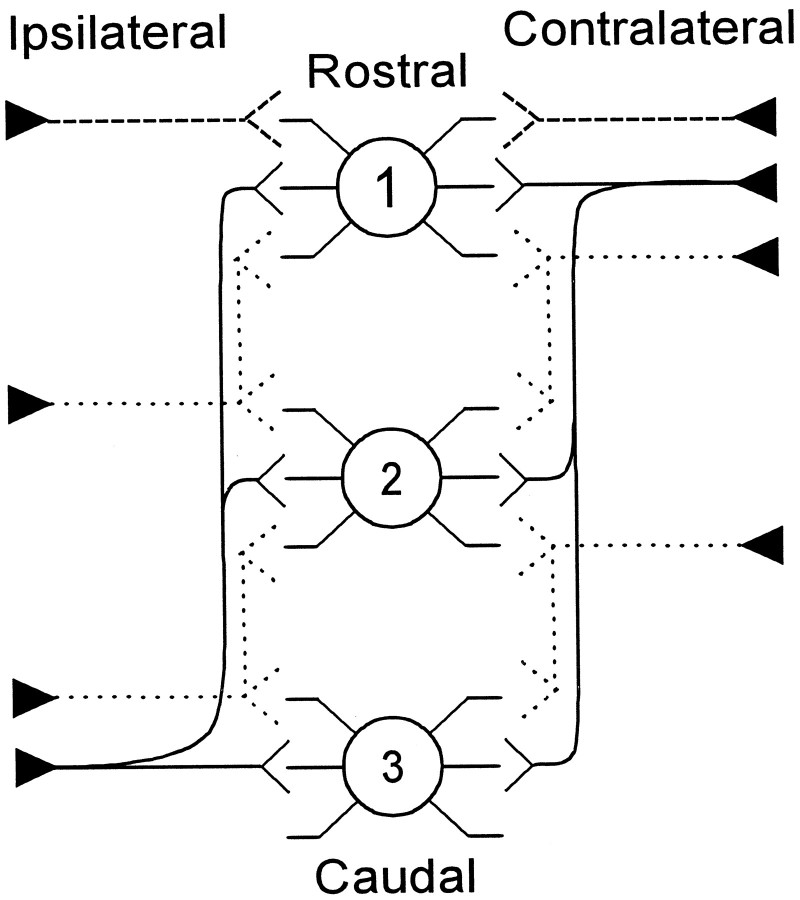
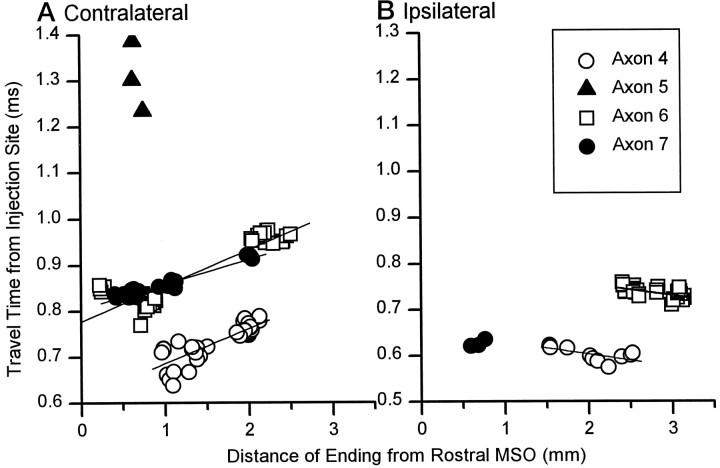
The differences in path length of axons from the anteroventral cochlear nuclei (AVCN) to the medial superior olive (MSO) are thought to provide the anatomical substrate for the computation of interaural time differences (ITD). We made small injections of biotinylated dextran into the AVCN that produced intracellular-like filling of axons. This permitted three-dimensional reconstructions of individual axons and measurements of axonal length to individual terminals in MSO. Some axons that innervated the contralateral MSO had collaterals with lengths that were graded in the rostrocaudal direction with shorter collaterals innervating more rostral parts of MSO and longer collaterals innervating more caudal parts of MSO. These could innervate all or part of the length of the MSO. Other axons had restricted terminal fields comparable to the size of a single dendritic tree in the MSO. In the ipsilateral MSO, some axons had a reverse, but less steep, gradient in axonal length with greater axonal length associated with more rostral locations; others had restricted terminal fields. Thus, the computation of ITDs is based on gradients of axonal length in both the contralateral and ipsilateral MSO, and these gradients may account for a large part of the range of ITDs encoded by the MSO. Other factors may be involved in the computation of ITDs to compensate for differences between axons.


Figures

Fig. 1.
Fig. 1.
Theoretical wiring diagrams for the medial superior olive. In each panel, cells in location 1 are rostral, and cells in location 3 are caudal. Innervating axons come from either the ipsilateral (I) or contralateral (C) side. A, The wiring pattern proposed by Jeffress (1948). The ipsilateral and contralateral axons both innervate the entire length of MSO by giving rise to successive collateral branches. However, the ipsilateral axon has shorter branches caudally, whereas the contralateral axon has shorter branches rostrally. B, The Goldberg scheme (Goldberg and Brown, 1969) has different axons that innervate different rostrocaudal locations within the MSO. Different axons have different lengths.C, The avian model in which contralateral axons follow the Jeffress scheme, but the ipsilateral axon innervates the full extent of MSO with collaterals of equal length. D, A fourth wiring scheme that is a combination of the previous three models. Here, individual axons of equal length innervate the MSO from the ipsilateral side. The shortest collateral branch of a single contralateral axon innervates the rostral end of MSO before successive branches innervate central and caudal MSO. All of these schemes can create a topographical organization of ITD along the rostrocaudal dimension of MSO.
Fig. 2.
Fig. 2.
Lower section numbers are more ventral. The injection site was located in the 1.75 kHz area of the rostral AVCN (sections 70, 76).Symbols in section 34 indicate the locations of three reconstructed axons where they cross the midline (filled square, axon 1 in Fig.4A; filled circle, axon 2 in Fig.4B; filled triangle, axon 3 in Fig. 6A). Scale bar, 1 mm. DCN, Dorsal cochlear nucleus; LTB, Lateral trapezoid body;PVCN, posteroventral cochlear nucleus; R, rostral.
Fig. 3.
Fig. 3.
Low-magnification drawings of case 94–89 that show the location of the dextran-filled axons in the 100-μm-thick horizontal sections. Here, the more dorsal sections contain the most rostral parts of MSO. A few axons crossed the midline near the center of the rostrocaudal extent of the trapezoid body (TB), whereas none crossed caudally. Symbols in section30 show four reconstructed axons where they cross the midline (filled square, axon 4 in Fig.4C; filled circle, axon 5 in Fig.6B; filled triangle, axon 6 in Fig. 5B; filled star, axon 7 in Fig.5A). Scale bar, 1 mm. AA, Anterior part of AVCN.
Fig. 4.
Fig. 4.
Three reconstructed axons with ladder-like branching pattern on the contralateral side and extensive branching on the ipsilateral side. The location of each MSO is indicated by thedashed line. A, Axon 1 terminated over the entire rostrocaudal length in the contralateral MSO (clusters of terminals ad) and most of the ipsilateral side (clusters of terminalseg). B, Axon 2 went to the central (a) and caudal parts (b, c) of contralateral MSO. Ipsilateral branches terminated in LSO (arrow) and MSO (df). C, Axon 4 terminated in the middle MSO on the contralateral side (a, b) and a similar area on the ipsilateral side (c, d). Scale bar, 1 mm.D, Dorsal; L, lateral.
Fig. 5.
Fig. 5.
Axons with limited ipsilateral branches and relatively more extensive contralateral branches. The location of each MSO is indicated by the dashed line. A, Axon 7 in the contralateral MSO has successively longer branches extending caudally (clusters of terminalsad), whereas on the ipsilateral side, terminals only were in rostral MSO (e). One collateral branch ended in the area of the lateral trapezoid body (LTB). B, Axon 6 terminated over the length of MSO on the contralateral side (bd). Branch a was in the medial periolivary area. On the ipsilateral side, one branch terminated in LSO, whereas the other went to the caudal MSO (e). Scale bar, 1 mm.
Fig. 6.
Fig. 6.
Axons with restricted branching patterns. The location of each MSO is indicated by the dashed line.A, Axon 3 terminated in caudal MSO contralaterally (clusters of terminals ac) and ipsilaterally (e). It also terminated in LSO (arrows). B, Axon 5 terminated only in the contralateral, rostral MSO (a). The axon continued to the ventral nucleus of the lateral lemniscus, where it gave off collaterals. Scale bar, 1 mm.
Fig. 7.
Fig. 7.
Camera lucida drawings of axon 2 in the contralateral MSO. A, First branch on contralateral side after crossing the midline trapezoid body. B, Second branch on contralateral side. C, Details of the middle terminals (Fig. 4B,b).D, Details of caudal terminals; see c in Figure 4B. E, The enlarged area ofD shows the location of five terminal boutons (arrowheads). These boutons could terminate on a single dendrite. F, Two calyceal endings in the medial trapezoid body in the superior olive contralateral to the cochlear nucleus injection. Both endings were seen in the same section of case 94–89. Both pieces were well filled at their terminals but could not be traced over any appreciable distance. Insert shows the position of calyceal endings (arrow) located medial to the rostral end of MSO. Scale bars:AD, 100 μm; E, 50 μm; insert, 1 mm.
Fig. 8.
Fig. 8.
Average diameter of axon 4 between branch points plotted as a function of length from injection site. Each branch point is indicated by a symbol. Top, The portion of the axon leading to four terminal boutons on different branches of the axon. Bottom, The branches leading to three terminals. Arrows indicate branches where one branch decreases in diameter while the other increases.
Fig. 9.
Fig. 9.
Sagittal views of each half of the three reconstructed axons in case 94–69. Open circles show axonal endings, whereas the open triangle indicates the most caudal ending in each MSO. Arrowheads show layers of terminals. Corresponding locations where the axons may overlap are indicated with double-headed arrows. Boutons in the ipsilateral LSO are marked by a bracket. Terminal fields of axonal endings on collateral branches (ag) are labeled as in Figures 4-6.A, B, Axon 1 (Fig.4A). C, D, Axon 2 (Fig. 4B). E, F, Axon 3 (Fig. 6A). The gray linesindicate the digitized outline of MSO from each horizontal section, as now seen in this sagittal view. Large steps (equal to section thickness) are a consequence of interpolation of depth coordinates, whereas small steps are an aliasing artifact and are not present in the data. Scale bar, 1 mm. M, Medial.
Fig. 10.
Fig. 10.
Sagittal view of each half of the four reconstructed axons in case 94–89. Symbols, gray lines, arrowheads, and arrows as in Figure 9. A, Axon 5 (Fig. 6B).B, C, Axon 7 (Fig. 5A).D, E, Axon 4 (Fig. 4C).F, G, Axon 6 (Fig. 5B). Small steps are an aliasing artifact and are not present in the data. Scale bar, 1 mm.
Fig. 11.
Fig. 11.
Length of axon from the injection site to each individual axonal ending is plotted as a function of the distance of the ending from the rostral MSO. These plots were made for the seven completely reconstructed axons in this study. Ipsilaterally, some axons from both cases (axons 1, 2, 4) gave off short daughter branches with terminal boutons immediately after branching to the ipsilateral MSO. These terminals produced a “dip” in the plot (arrows).
Fig. 12.
Fig. 12.
Schematic summary of the innervation patterns of the reconstructed axons from low-frequency rostral AVCN to the MSO. In a pattern similar to the Jeffress model (solid line), on the contralateral side the shortest branch terminated in the rostral end of MSO (1). Successively longer branches went to the middle (2) and caudal (3) ends of MSO. On the ipsilateral side, the shortest branch went to the caudal end of MSO with successively longer branches to central and rostral MSO, respectively. A second pattern was evident in axons with more limited termination pattern (short dashed line). Still, a third pattern was evident where individual axons terminated in restricted field (long dashed lines).
Fig. 13.
Fig. 13.
The travel time from injection site to each ending in MSO is plotted against the distance of that ending from the rostral MSO for case 94–89. Slopes were calculated for individual axons with terminals that were distributed >0.2 mm along the rostrocaudal extent of MSO. Terminals at the entry point on the ipsilateral side at 1.5 mm were also not included in the calculations.
Fig. 14.
Fig. 14.
Measured and predicted widths of interaural delay curves in the MSO. Open circles are widths measured at 50% of maximum response (Fitzpatrick et al., 1997). Solid line denotes theoretical widths at each frequency (see Materials and Methods). Bottom, thick dotted line indicates the effect of scatter within individual axons caused by variation of axon collateral length. For the contralateral MSO of case 94–89, the average residual error for the linear regression between conduction time and MSO location was ±23 μsec (n = 3). For the ipsilateral MSO, it was ±10 μsec (n = 2). These times represent the increase in the variability of travel times from the AVCN of either side to the MSO. This increase in variability corresponds to an increase in tuning width of 59 μsec. The top, dashed lineindicates the effect of variation in length between axons. The average difference in travel time between axons was estimated as ∼400 μsec, and the corresponding increase in tuning width was estimated as ∼900 μsec.

References

    1. Batra R, Kuwada S, Fitzpatrick DC. Sensitivity to interaural temporal disparities of low- and high-frequency neurons in the superior olivary complex: I. Heterogeneity of responses. J Neurophysiol. 1997a;78:1222–1236. - PubMed
    1. Batra R, Kuwada S, Fitzpatrick DC. Sensitivity to interaural temporal disparities of low- and high-frequency neurons in the superior olivary complex: II. Coincidence detection. J Neurophysiol. 1997b;78:1237–1247. - PubMed
    1. Bernstein LR, Trahiotis C. The normalized correlation: Accounting for binaural detection across center frequency. J Acoust Soc Am. 1996;100:3774–3784. - PubMed
    1. Cant NB. The cochlear nucleus: neuronal types and their synaptic organization. In: Webster DB, Popper AN, Ray RR, editors. The Mammalian auditory pathway: neuroanatomy, Vol 1. Springer; New York: 1992. pp. 66–116.
    1. Cant NB, Hyson RL. Projections from the lateral nucleus of the trapezoid body to the medial superior olivary nucleus in the gerbil. Hear Res. 1992;58:26–34. - PubMed

Publication types

LinkOut - more resources