. 1999 Apr 15;19(8):3223-37.
doi: 10.1523/JNEUROSCI.19-08-03223.1999.

Mechanisms of neural synchrony in the septohippocampal pathways underlying hippocampal theta generation

Affiliations

Mechanisms of neural synchrony in the septohippocampal pathways underlying hippocampal theta generation

B H Bland et al. J Neurosci. .

Abstract

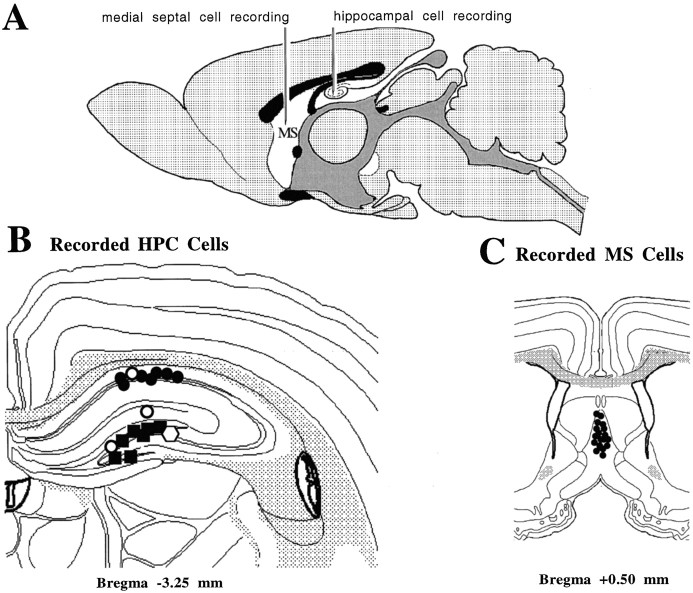
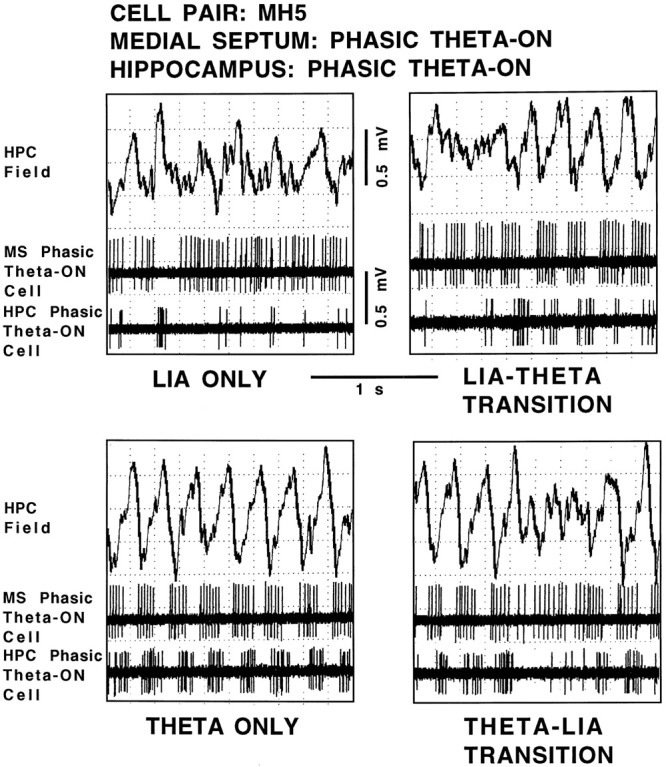
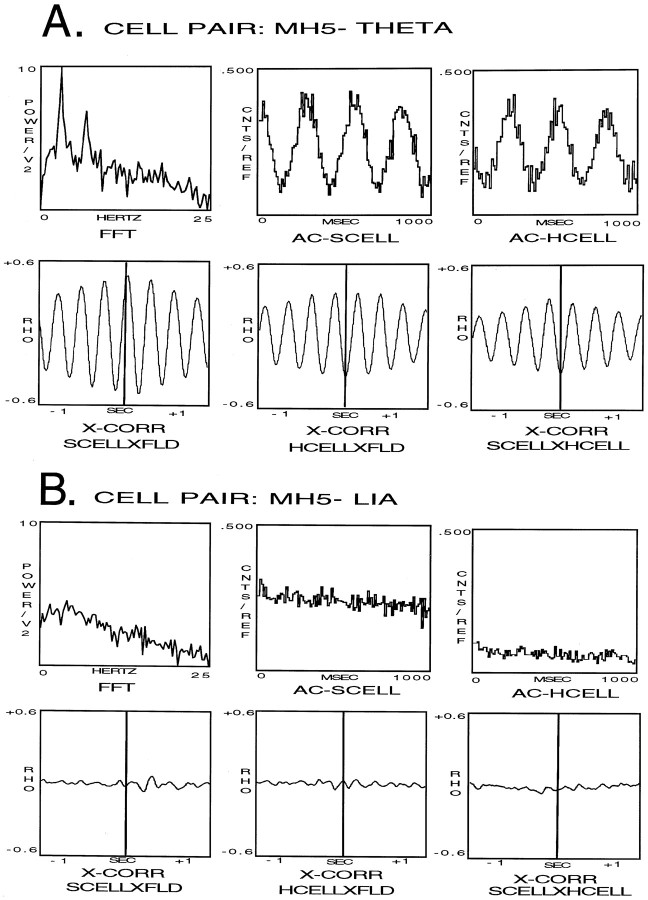
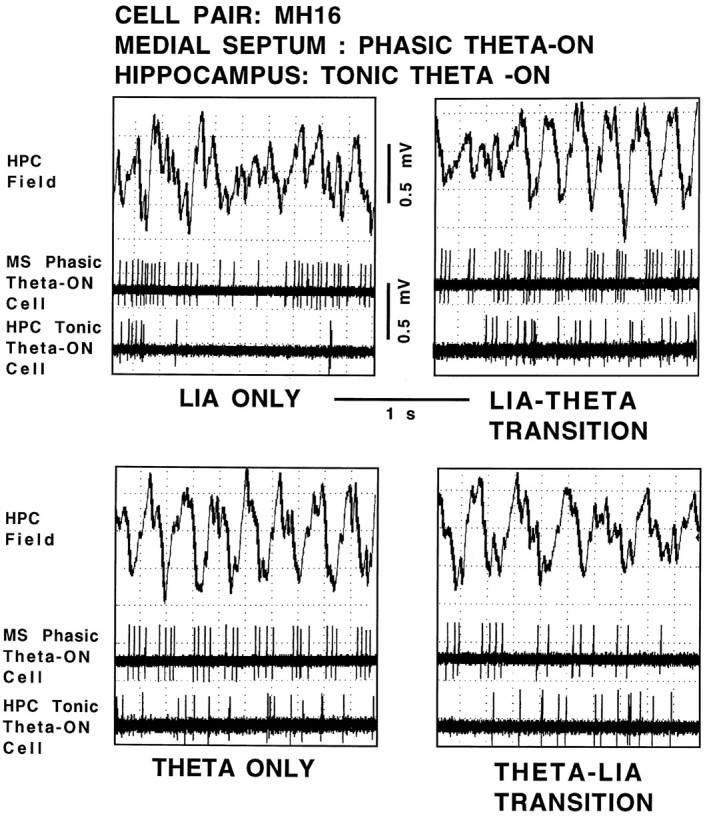
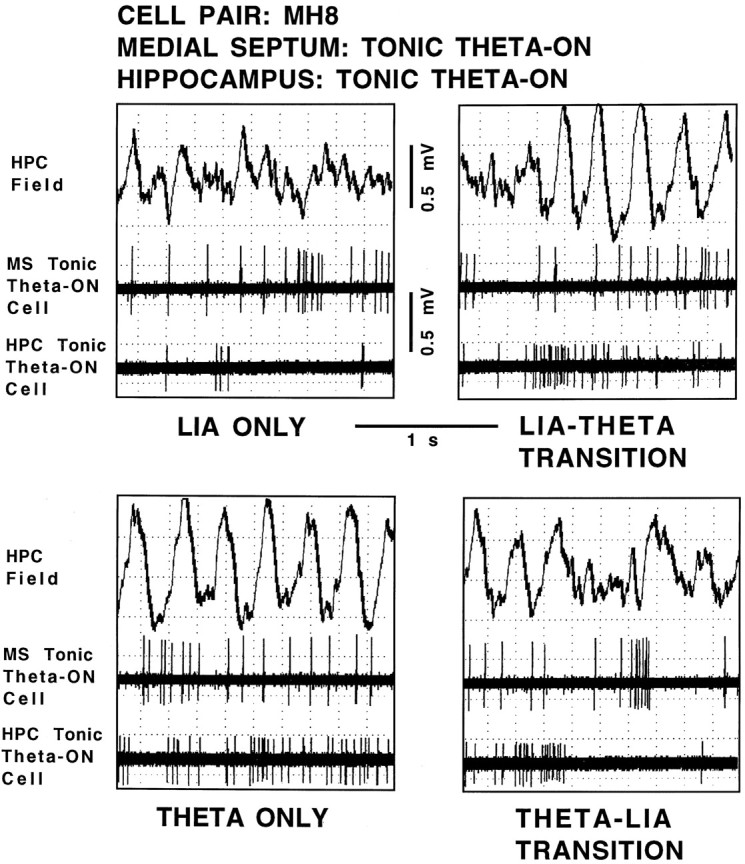
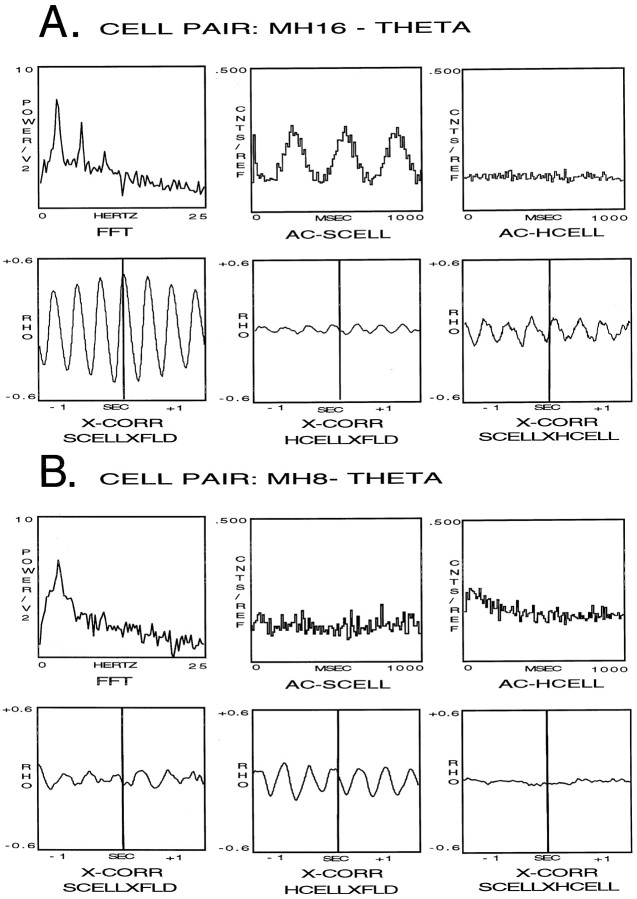
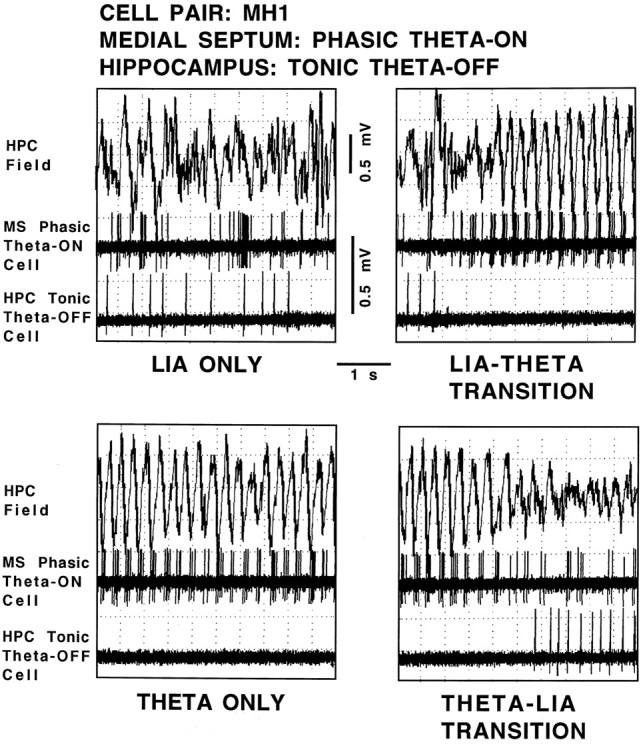
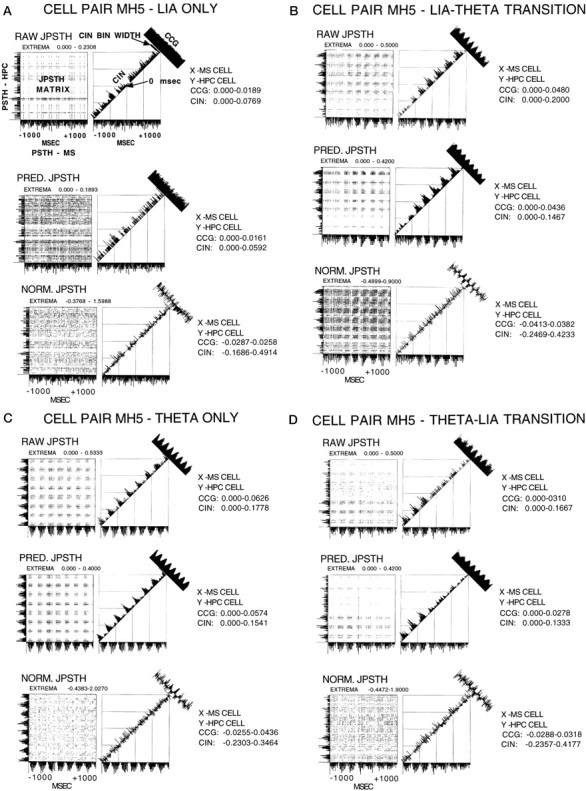
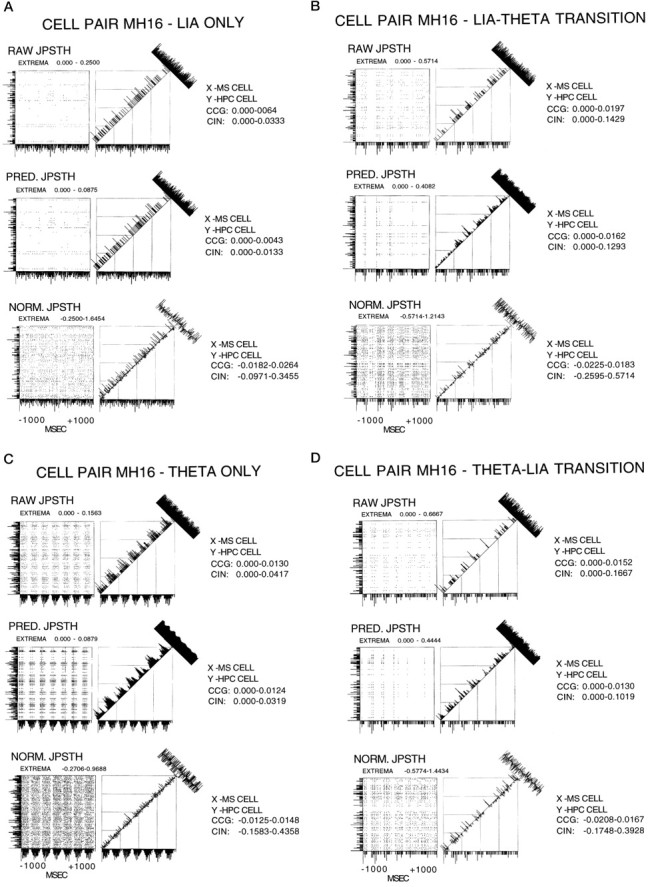
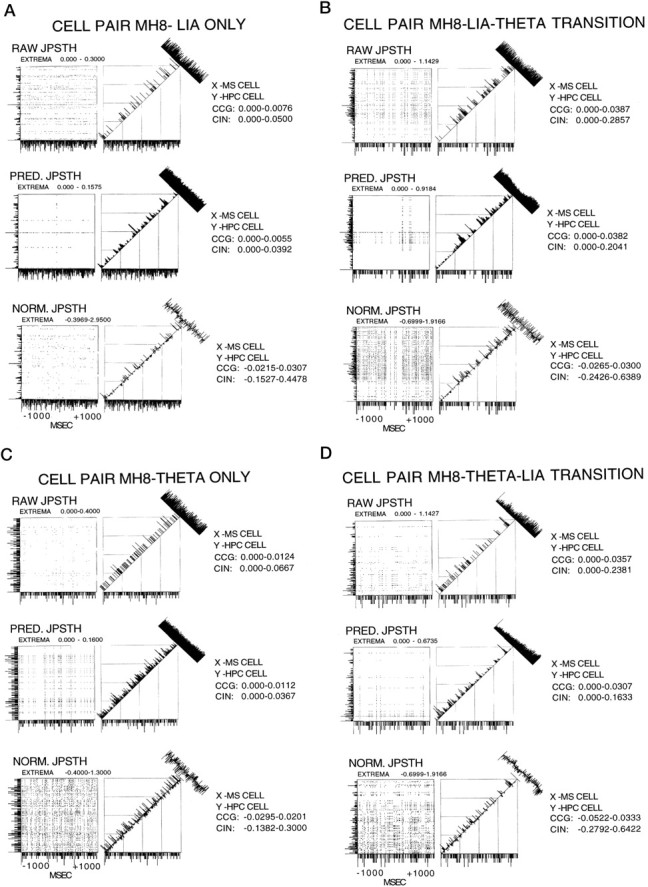
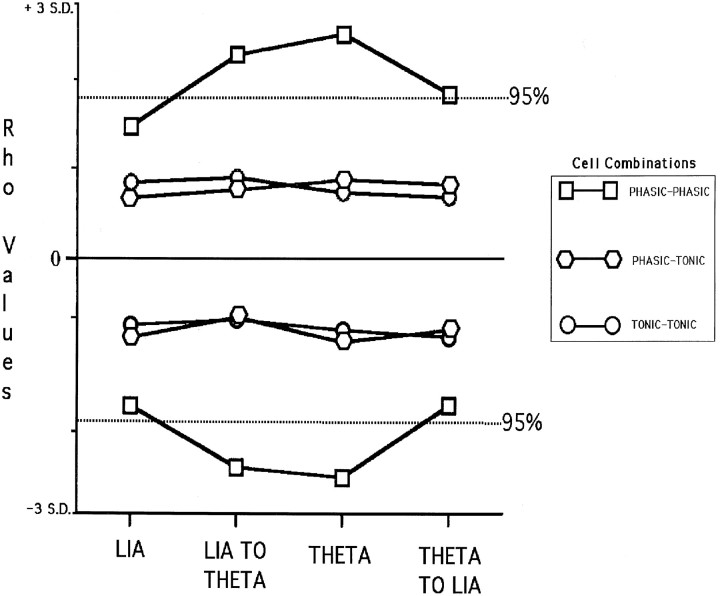
Using urethane-anesthetized rats, 18 simultaneously recorded septohippocampal cell pairs (36 individual cells), each classified as theta-related according to the criteria of, were studied during four spontaneously occurring hippocampal field conditions: (1) large amplitude irregular activity (LIA) only; (2) the transition from LIA to theta; (3) theta only; and (4) the transition from theta to LIA. The main objective was to study the temporal relationships and degree of neural synchrony between the discharges of the cell pairs, using both time-averaged and time-dependent joint peristimulus time histogram correlation techniques, during the four conditions, to determine their contribution to the control of oscillation and synchrony (theta) in the hippocampus. The study demonstrated that the transition from the LIA state to the theta field state in the hippocampus required a temporal sequence of changes in theta-related cellular activity occurring on average 500 msec preceding the transition: (1) the medial septum inhibits hippocampal theta-OFF cells; (2) medial septal tonic theta-ON cells provide tonic depolarizing inputs to initiate membrane potential oscillations (MPOs) in hippocampal phasic theta-ON cells, whereas medial septal phasic theta-ON cells synchronize the MPOs of hippocampal phasic theta-ON cells and the discharges of hippocampal tonic theta-ON cells. Much of the time preceding the LIA to theta transition is accounted for by recruitment of these theta-related cell populations. Conversely, "turning off" the theta state occurs abruptly and involves the medial septal disinhibition of hippocampal theta-OFF cells.


Figures

Fig. 1.
Fig. 1.
A, A diagrammatic representation of the recording arrangement. A tungsten microelectrode was fixed in the region of the stratum moleculare of the dentate on the right side of the brain to record hippocampal field activity (data not shown). Glass microelectrodes carried in independent micromanipulators were simultaneously lowered into the medial septum/vertical limb of the diagonal band of Broca and the hippocampal formation on the left side of the brain, respectively, for the isolation and recording of single cells. B, A diagrammatic reconstruction of cells recorded in the hippocampal formation and classified as theta-related according to the system of Colom and Bland (1987). Seven cells in the CA1 cell body layer (solid circles) and seven cells in the dentate cell body layer (solid circles), for a total of 14 cells, were classified as theta-ON cells (see Results for subclassifications). One cell in the upper blade of the dentate cell body layer was classified as nonrelated (solid square). One cell in the CA1 cell layer (open circle), one cell in the stratum lacunosum region (open circle), and one cell in the upper blade of the dentate cell layer (open circle), for a total of three cells, were classified as theta-OFF cells (see Results for subclassifications).C, A diagrammatic reconstruction of the 18 cells recorded in the medial septal nuclei. All cells were classified as theta-ON (solid circles) and were recorded in a depth range (from the dural surface) of 4.7–5.7 mm. Histology was reconstructed using Swanson’s (1992) atlas.
Fig. 2.
Fig. 2.
Hippocampal field-related discharges of cell pair MH5, a medial septal phasic theta-ON cell and a hippocampal phasic theta-ON cell. The top trace in each panel is the hippocampal field recorded from the region of the stratum moleculare of the dentate gyrus, and the middle andbottom panels are recordings of the medial septal cell and hippocampal cell, respectively, all simultaneously recorded during the four spontaneously occurring field states: LIA ONLY,LIA-THETA TRANSITION, THETA ONLY, and THETA-LIA TRANSITION.
Fig. 3.
Fig. 3.
Analyses of the hippocampal field and cellular activity of cell pair MH5. A, During theta field activity. The top left panel is the frequency spectrum resulting from the FFT analysis of the hippocampal theta field activity, the top middle panel is an AC analysis of S, and the top right panel is an AC histogram of H. Thebottom left panel is a cross-correlation analysis between the septal cell and the theta field activity, the bottom middle panel is a cross-correlation analysis of the hippocampal cell and the theta field activity, and the bottom right panel is a cross-correlation analysis between the septal cell and the hippocampal cell during theta field activity. B, The equivalent analyses as in A, only made during LIA field activity.
Fig. 4.
Fig. 4.
Hippocampal field-related discharges of cell pair MH16, a medial septal phasic theta-ON cell and a hippocampal tonic theta-ON cell. The top trace in each panel is the hippocampal field recorded from the region of the stratum moleculare of the dentate gyrus, and the middle and bottom panels are recordings of the medial septal cell and hippocampal cell, respectively, all simultaneously recorded during the four spontaneously occurring field states: LIA ONLY,LIA-THETA TRANSITION, THETA ONLY, and THETA-LIA TRANSITION.
Fig. 5.
Fig. 5.
Hippocampal field-related discharges of cell pair MH8, a medial septal tonic theta-ON cell and a hippocampal tonic theta-ON cell. The top trace in each panel is the hippocampal field recorded from the region of the stratum moleculare of the dentate gyrus, and the middle and bottom panels are recordings of the medial septal cell and hippocampal cell, respectively, all simultaneously recorded during the four spontaneously occurring field states: LIA ONLY,LIA-THETA TRANSITION, THETA ONLY, and THETA-LIA TRANSITION.
Fig. 6.
Fig. 6.
Analyses of the hippocampal field and cellular activity of cell pair MH16 (A) and cell pair MH8 (B) during theta field activity. The top left panel is the frequency spectrum resulting from the FFT analysis analysis of the hippocampal theta field activity, thetop middle panel is an AC analysis of S, and thetop right panel is an AC histogram of H. Thebottom left panel is a cross-correlation analysis between the septal cell and the theta field activity, the bottom middle panel is a cross-correlation analysis of the hippocampal cell and the theta field activity, and the bottom right panel is a cross-correlation analysis between the septal cell and the hippocampal cell during theta field activity.
Fig. 7.
Fig. 7.
Hippocampal field-related discharges of cell pair MH1, a medial septal phasic theta-ON cell and a hippocampal tonic theta-OFF cell. The top trace in each panel is the hippocampal field recorded from the region of the stratum moleculare of the dentate gyrus, and the middle and bottom panels are recordings of the medial septal cell and hippocampal cell, respectively, all simultaneously recorded during the four spontaneously occurring field states: LIA ONLY,LIA-THETA TRANSITION, THETA ONLY, and THETA-LIA TRANSITION.
Fig. 8.
Fig. 8.
A, JPSTH analysis of cell pair MH5 for the condition of LIA only. For all JPSTHs, they-axis PSTH is the hippocampal cell, and thex-axis PSTH is the medial septal cell. Thex- and y-axis range was −1000 to +1000 msec. Bin width for the PSTHs and the JPSTH matrix was 9 msec, and the display for both these as well as the CCG and CIN histograms was normalized counts per trial (in hertz). The JPSTH matrix and the CCG and CIN histograms for the raw (top), predicted (middle), and normalized (bottom) all indicate a lack of relationship between the cells during LIA only.B, JPSTH analysis of cell pair MH5 for the condition of LIA to theta transition. For all JPSTHs, the y-axis PST is the hippocampal cell, and the x-axis PST is the medial septal cell. The x- and y-axis range was −1000 to +1000 msec. Bin width for the PSTHs and the JPSTH matrix was 9 msec, and the display for both these as well as the CCG and CIN histograms was normalized counts per trial (in hertz). The JPSTH matrix and CIN histogram in B (top) show that the cells synchronized their discharges during LIA, before the onset of theta. B (middle) shows the same results as illustrated with the raw JPSTH analysis, in this case caused by the synchronizing effects of the stimulus (theta). The JPSTH matrix inB (bottom) demonstrates after correcting for the stimulus (theta)-driven synchronizing effects, the cell discharges were strongly related before theta onset. After normalization the CIN was noisy, but the CCG display indicates that the cells were correlated with 3.8% of the synchrony remaining.C, JPSTH analysis of cell pair MH5 for the condition of theta only. For all JPSTHs the y-axis PSTH is the hippocampal cell, and the x-axis PSTH is the medial septal cell. The x- and y-axis range was −1000 to +1000 msec. Bin width for the PSTHs and the JPST matrix was 9 msec, and the display for both these as well as the CCG and CIN histograms was normalized counts per trial (in hertz). The JPSTH matrix and CIN histogram in C (top) show that the cells synchronized their discharges during theta.C (middle) shows the same results as illustrated with the raw JPSTH analysis, in this case because of the synchronizing effects of the stimulus (theta). The JPSTH matrix in C (bottom) demonstrates after correcting for the stimulus (theta)-driven synchronizing effects, the cell discharges were still strongly related. After normalization the CIN was noisy, but the CCG indicates that the cells were correlated, accounting for 4.4% of the synchrony. D, JPSTH analysis of cell pair MH5 for the condition of theta to LIA transition. For all JPSTHs the y-axis PSTH is the hippocampal cell, and the x-axis PSTH is the medial septal cell. The x- and y-axis range was −1000 to +1000 msec. Bin width for the PSTHs and the JPSTH matrix was 9 msec, and the display for both these as well as the CCG and CIN histograms was normalized counts per trial (in hertz). The JPSTH matrix and CIN histogram in D (top) show that the cell discharges became nonsynchronized abruptly at the theta to LIA transition. D (middle) shows the same results as illustrated with the raw JPSTH analysis, in this case caused by the synchronizing effects of the stimulus (theta). The JPSTH matrix in D (bottom) demonstrates after correcting for the stimulus (theta)-driven synchronizing effects, the cell discharges were still strongly related during theta field activity. After normalization the CIN was noisy, but the CCG display indicates that the cells were correlated, accounting for 3.2% of the synchrony.
Fig. 9.
Fig. 9.
A, JPSTH analysis of cell pair MH16 for the condition of LIA only. For all JPSTHs the y-axis PSTH is the hippocampal cell, and the x-axis PSTH is the medial septal cell. The x- and y- axis range was −1000 to +1000 msec. Bin width for the PSTHs and the JPSTH matrix was 9 msec, and the display for both these as well as the CCG and CIN histograms was normalized counts per trial (in hertz). The JPSTH matrix, and the CCG and CIN histograms for the raw (top), predicted (middle), and normalized (bottom) all indicate a lack of relationship between the cells during LIA only. B, JPSTH analysis of cell pair M16 for the condition of LIA to theta transition. For all JPSTHs they-axis PSTH is the hippocampal cell, and the x-axis PSTH is the medial septal cell. The x- and y-axis range was −1000 to +1000 msec. Bin width for the PSTHs and the JPSTH matrix was 9 msec, and the display for both these as well as the CCG and CIN histograms was normalized counts per trial (in hertz). The JPSTH matrix and CIN histogram in B (top) show that the cells synchronized their discharges during LIA, before the onset of theta. B (middle) shows the same results as illustrated with the raw JPSTH analysis, in this case caused by the synchronizing effects of the stimulus (theta). The JPSTH matrix inB (bottom) demonstrates after correcting for the stimulus (theta)-driven synchronizing effects, the cell discharges were related before theta onset. After normalization the CIN was noisy, but the CCG display indicates that the cells were weakly correlated, accounting for 1.8% of the synchrony. C, JPSTH analysis of cell pair MH16 for the condition of theta only. For all JPSTHs the y-axis PSTH is the hippocampal cell, and the x-axis PSTH is the medial septal cell. Thex- and y-axis range was −1000 to +1000 msec. Bin width for the PSTHs and the JPSTH matrix was 9 msec, and the display for both these as well as the CCG and CIN histograms was normalized counts per trial (in hertz). The JPSTH matrix and CIN histogram in C (top) indicate that the cells synchronized their discharges during theta. C(middle) shows the same results as illustrated with the raw JPSTH analysis, in this case caused by the synchronizing effects of the stimulus (theta). The JPSTH matrix in C(bottom) demonstrates after correcting for the stimulus (theta)-driven synchronizing effects, the cell discharges were still related. After normalization the CIN was noisy, but the CCG indicates that the cells were weakly correlated, accounting for 1.5% of the synchrony. D, JPSTH analysis of cell pair MH16 for the condition of theta to LIA transition. For all JPSTHs they-axis PSTH is the hippocampal cell, and thex-axis PSTH is the medial septal cell. Thex- and y-axis range was −1000 to +1000 msec. Bin width for the PSTHs and the JPSTH matrix was 9 msec, and the display for both these as well as the CCG and CIN histograms was normalized counts per trial (in hertz). The JPSTH matrix and CIN histogram in D (top) show that the cell discharges became nonsynchronized abruptly at the theta to LIA transition. D (middle) shows the same results as illustrated with the raw JPSTH analysis, in this case caused by the synchronizing effects of the stimulus (theta). The JPSTH matrix in D (bottom) demonstrates after correcting for the stimulus (theta)-driven synchronizing effects, the cell discharges were not related during theta field activity. After normalization the CIN was noisy, and the CCG display indicates that the cells were not correlated.
Fig. 10.
Fig. 10.
A, JPSTH analysis of cell pair MH8 for the condition of LIA only. For all JPSTs, the y-axis PSTH is the hippocampal cell, and the x-axis PSTH is the medial septal cell. The x- and y-axis range was −1000 to +1000 msec. Bin width for the PSTHs and the JPSTH matrix was 9 msec, and the display for both these as well as the CCG and CIN histograms was normalized counts per trial (in hertz). The JPSTH matrix, and the CCG and CIN histograms for the raw (top), predicted (middle), and normalized (bottom) all indicate a lack of relationship between the cells during LIA only. B, JPSTH analysis of cell pair MH8 for the condition of LIA to theta transition. For all JPSTHs they-axis PSTH is the hippocampal cell, and the x-axis PSTH is the medial septal cell. The x- and y-axis range was −1000 to +1000 msec. Bin width for the PSTHs and the JPSTH matrix was 9 msec, and the display for both these as well as the CCG and CIN histograms was normalized counts per trial (in hertz). The JPSTH matrix and CIN histogram in B (top) show that the cell discharges were not synchronized. B(middle) shows the same results as illustrated with the raw JPSTH analysis, in this case caused by the synchronizing effects of the stimulus (theta). The JPSTH matrix in B(bottom) demonstrates after correcting for the stimulus (theta)-driven synchronizing effects, the cell discharges were also not related previous to theta onset. After normalization the CIN was noisy, and the CCG display indicated that the cells were not correlated.C, JPSTH analysis of cell pair MH8 for the condition of theta only. For all JPSTHs the y-axis PSTH is the hippocampal cell, and the x-axis PSTH is the medial septal cell. The x- and y-axis range was −1000 to +1000 msec. Bin width for the PSTHs and the JPSTH matrix was 9 msec, and the display for both these as well as the CCG and CIN histograms was normalized counts per trial (in hertz). The JPSTH matrix and CIN histogram in C (top) indicate that the cells did not synchronize their discharges during theta.C (middle) shows the same results as illustrated with the raw JPSTH analysis, in this case caused by the synchronizing effects of the stimulus (theta). The JPSTH matrix inC (bottom) demonstrates after correcting for the stimulus (theta)-driven synchronizing effects, the cell discharges were not related. After normalization the CIN was noisy, and the CCG indicates that the cells were not correlated. D, JPSTH analysis of cell pair MH8 for the condition of theta to LIA transition. For all JPSTHs the y-axis PSTH is the hippocampal cell, and the x-axis PSTH is the medial septal cell. The x- and y-axis range was −1000 to +1000 msec. Bin width for the PSTHs and the JPSTH matrix was 9 msec, and the display for both these as well as the CCG and CIN histograms was normalized counts per trial (in hertz). The JPSTH matrix and CIN histogram in D (top) show that the cell discharges were not synchronized. D(middle) shows the same results as illustrated with the raw JPSTH analysis, in this case caused by the synchronizing effects of the stimulus (theta). The JPSTH matrix in D(bottom) demonstrates after correcting for the stimulus (theta)-driven synchronizing effects, the cell discharges were not related during theta field activity. After normalization the CIN was noisy, and the CCG display indicated that the cells were not correlated.
Fig. 11.
Fig. 11.
Graph of the positive and negative Rho values of the phasic–phasic, phasic–tonic, and tonic–tonic septohippocampal cell pairs, for each of the four conditions analyzed (LIA, LIA TO THETA, THETA, and THETA TO LIA), plotted relative to the SDs calculated for the respective CCGs. Only phasic–phasic cell pairs during the LIA to theta transition and the theta only condition had significant values (>2 SDs from the mean) (p ≤ 0.05).

References

    1. Ahmed N, Rao KR. Orthogonal transforms for digital signal processing. Springer; Berlin: 1975.
    1. Alonso A, Gaztelu JM, Buno W, Jr, Garcia-Austt E. Cross-correlation analysis of septohippocampal neurons during θ-rhythm. Brain Res. 1987;413:135–146. - PubMed
    1. Artemenko DP. Participation of hippocampal neurons in theta-wave generation. Neurophysiology. 1973;4:409–415. - PubMed
    1. Barrenechea C, Pedemonte M, Nunez A, Garcia-Austt E. In vivo intracellular recordings of medial septal and diagonal band of Broca neurons: relationships with theta rhythm. Exp Brain Res. 1995;103:31–40. - PubMed
    1. Bland BH. The physiology and pharmacology of hippocampal formation theta rhythms. Prog Neurobiol. 1986;26:1–54. - PubMed

Publication types

LinkOut - more resources