. 1999 May;73(5):3649-60.
doi: 10.1128/JVI.73.5.3649-3660.1999.

Transduction of human progenitor hematopoietic stem cells by human immunodeficiency virus type 1-based vectors is cell cycle dependent

Affiliations

Transduction of human progenitor hematopoietic stem cells by human immunodeficiency virus type 1-based vectors is cell cycle dependent

R E Sutton et al. J Virol. 1999 May.

Abstract

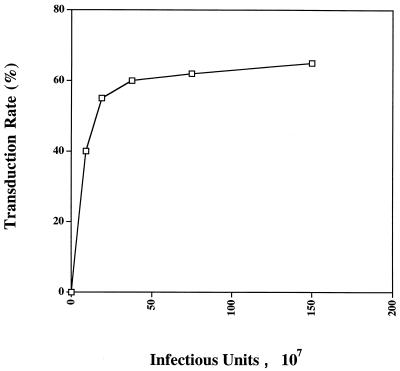
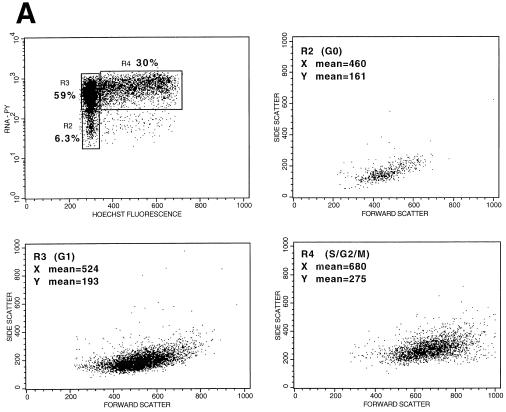
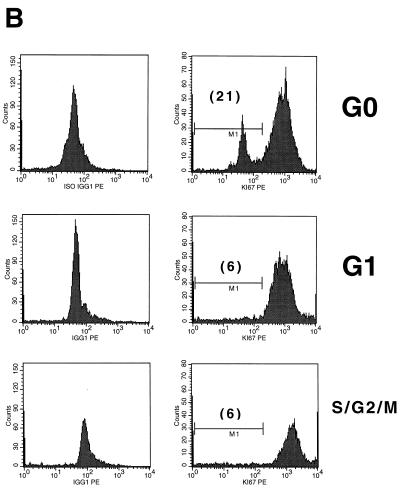
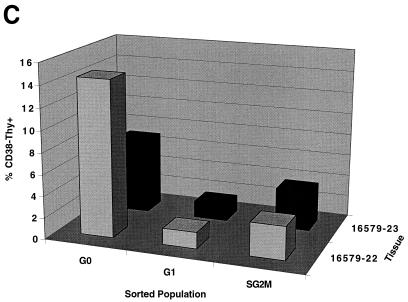
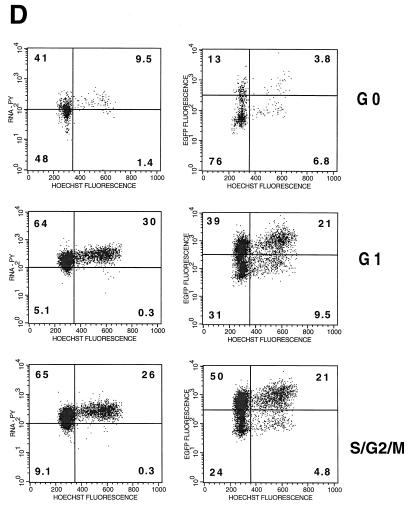
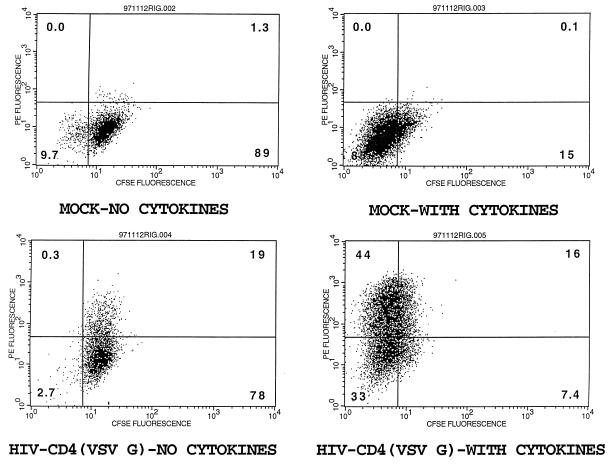
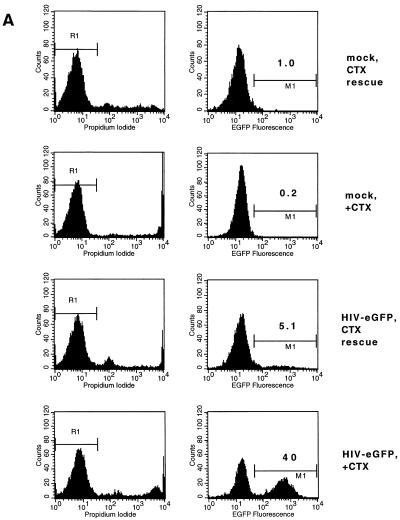
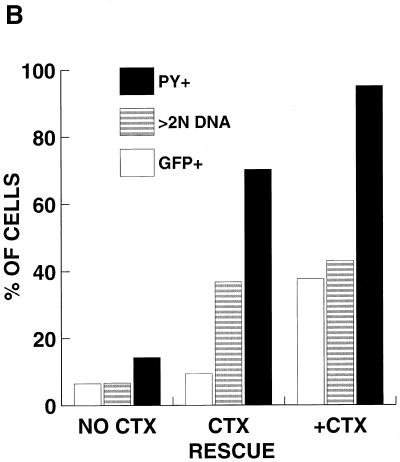
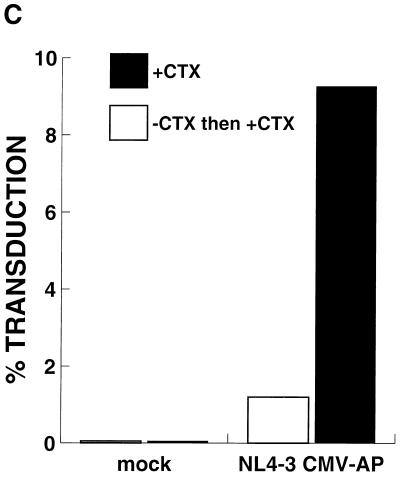
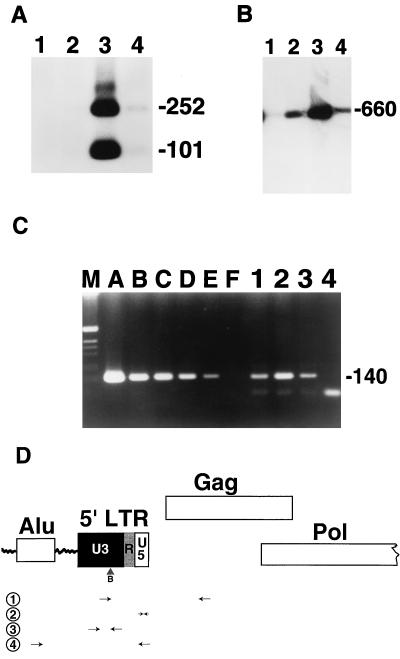
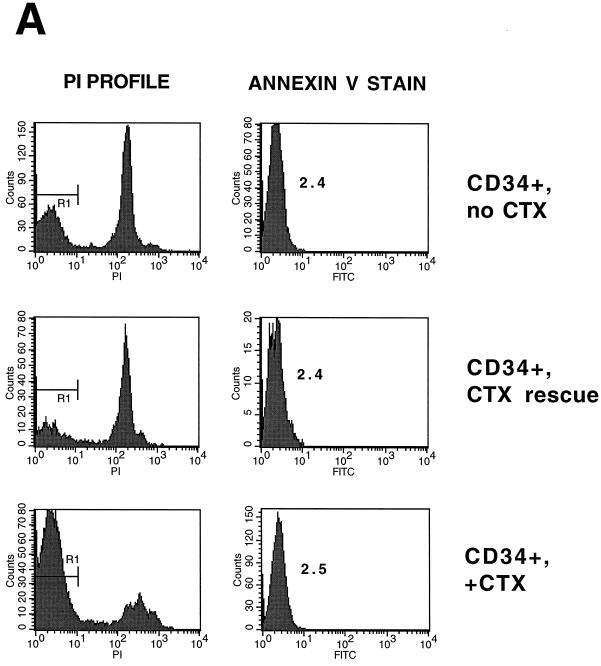
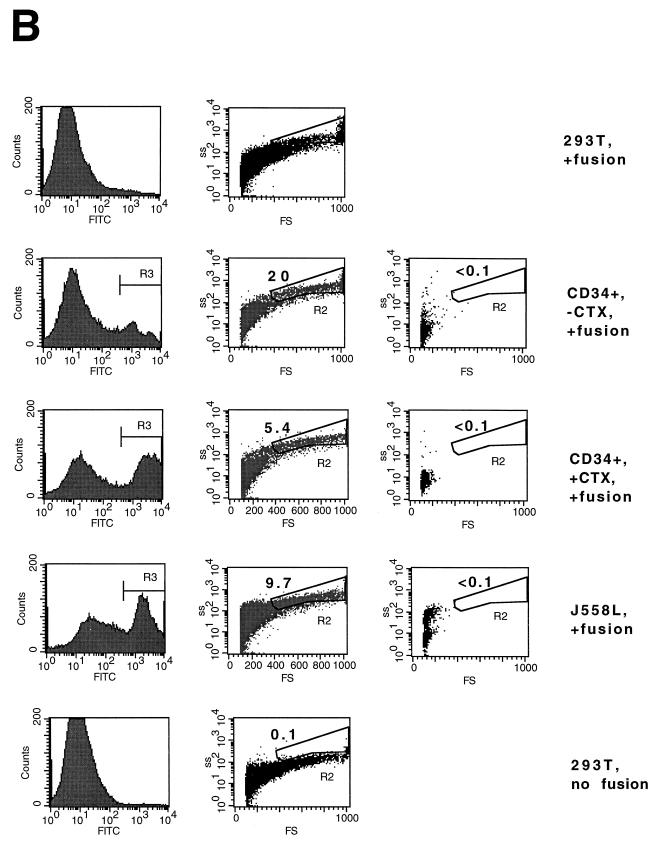
Human immunodeficiency virus (HIV) type 1 vectors are highly efficient in their ability to transduce human progenitor hematopoietic stem cells (PHSC). Although mitosis was not required for transduction of these cells, transduction rates were much greater once cells had been cultured in the presence of cytokines. Transduction rates, however, rarely exceeded 70%. We demonstrate here that there is a distinct subpopulation that is more easily transduced by HIV vectors. These cells were distinguished by a disproportionate population in the S/G2/M phases of the cell cycle. By sorting them prior to transduction, we found that those cells in either the G1 or S/G2/M fraction were more readily transduced than G0 cells. Maintaining the cells in G0 by omitting cytokines from the medium reduced transduction rates by up to 10-fold. Addition of cytokines to the medium immediately after transduction did not improve the transduction efficiency as measured by expression of the transgene. Analysis of replication intermediates indicated that the block to transduction of G0 cells operated near the time of initiation of reverse transcription. These results suggest that although lentivirus vectors can transduce nondividing PHSC, transduction efficiency is severalfold greater once the cells exit G0 and enter G1. Further characterization of these more transducible cells and identification of the cellular factors responsible may enhance transduction while maintaining the pluripotentiality of the PHSC.


Figures

FIG. 1
FIG. 1
Not all PHSC are transduced by an HIV vector. Increasing amounts of ultracentrifuge-concentrated pHIV-APΔenvΔVifΔVpr(VSV G) were used to transduce 2 × 10⁵ PHSC overnight in a total volume of 1.0 ml in the presence of 4 μg of Polybrene per ml. Prior to transduction, the PHSC had been cultured in cytokines for 48 h, and cells were stained for alkaline phosphatase by using BCIP-NBT at 72 h after transduction.
FIG. 2
FIG. 2
Differences in transduction efficiency among PHSC subpopulations. PHSC were cultured in cytokines for 48 h prior to overnight transduction with either ultracentrifuge-concentrated HIV-CD4(VSV G), HIV-eGFP(VSV G), or both. Three days after transduction, cells were stained with anti-CD4–PE as described in the text and analyzed on a FACStar. (A) Flow cytometry for CD4 and GFP expression, with respective quadrant percentages shown. Numbers in parentheses indicate percentages expected if transductions had occurred completely independently, by random chance alone. (B) Average values for four separate double-transduction experiments. For each transduced population, the expected value (based upon random chance) has been normalized to 100%. ∗, P > 0.05; ∗∗, P < 0.05 (observed values compared to expected values by a two-sample Student t test). Error bars indicate standard errors.
FIG. 2
FIG. 2
Differences in transduction efficiency among PHSC subpopulations. PHSC were cultured in cytokines for 48 h prior to overnight transduction with either ultracentrifuge-concentrated HIV-CD4(VSV G), HIV-eGFP(VSV G), or both. Three days after transduction, cells were stained with anti-CD4–PE as described in the text and analyzed on a FACStar. (A) Flow cytometry for CD4 and GFP expression, with respective quadrant percentages shown. Numbers in parentheses indicate percentages expected if transductions had occurred completely independently, by random chance alone. (B) Average values for four separate double-transduction experiments. For each transduced population, the expected value (based upon random chance) has been normalized to 100%. ∗, P > 0.05; ∗∗, P < 0.05 (observed values compared to expected values by a two-sample Student t test). Error bars indicate standard errors.
FIG. 3
FIG. 3
Transduced cells are more likely than untransduced cells to express PCNA. PHSC were mock transduced or transduced overnight with ultracentrifuge-concentrated HIV-CD4(VSV G). Cells were analyzed by flow cytometry 48 h after transduction for nuclear PCNA and surface CD4 expression, using anti-PCNA–PE (or an isotype-matched control [ISO-PE]) and anti-CD4–FITC, respectively (see text for details). Quadrant percentages are indicated. CD4+ cells were significantly more likely than CD4 cells to be positive for PCNA (P < 0.001 by the Kolmogorov-Smirnov two-sample test).
FIG. 4
FIG. 4
PHSC which have exited G0 are more readily transduced. (A) PHSC were cultured in cytokines for 48 h prior to sorting based on Pyronin Y (PY) and Hoechst 33342 staining. Percentages of each sorted population are shown, along with x and y means for forward and side scatters, respectively. (B) Sorted PHSC were stained by using anti-Ki67–PE (right column) or an isotype-matched control (left column). Only the G0 subpopulation, as defined by Pyronin Y and Hoechst staining had a distinct population of cells that did not detectably express Ki-67. (C) PHSC were sorted based upon Pyronin Y and Hoechst staining, and then each subpopulation was subsequently stained by using anti-lineage–FITC, anti-CD34–TR/SR, anti-Thy–PE, and anti-CD38–APC antibodies, along with appropriate isotype-matched controls. Live cells were gated by exclusion of PI. Results from two independent tissue samples are shown. (D) Sorted populations were transduced overnight with concentrated HIV-eGFP(VSV G) and analyzed 72 h later for enhanced GFP (EGFP) expression, Pyronin Y staining, and Hoechst staining. Quadrant percentages are indicated. Left column, Pyronin Y versus Hoechst; right column, GFP versus Hoechst. Note that for each subpopulation, the S/G2/M population of the transduced cells is two- to fourfold greater than that of the untransduced PHSC. Similar transduction percentages were observed 7 days later.
FIG. 4
FIG. 4
PHSC which have exited G0 are more readily transduced. (A) PHSC were cultured in cytokines for 48 h prior to sorting based on Pyronin Y (PY) and Hoechst 33342 staining. Percentages of each sorted population are shown, along with x and y means for forward and side scatters, respectively. (B) Sorted PHSC were stained by using anti-Ki67–PE (right column) or an isotype-matched control (left column). Only the G0 subpopulation, as defined by Pyronin Y and Hoechst staining had a distinct population of cells that did not detectably express Ki-67. (C) PHSC were sorted based upon Pyronin Y and Hoechst staining, and then each subpopulation was subsequently stained by using anti-lineage–FITC, anti-CD34–TR/SR, anti-Thy–PE, and anti-CD38–APC antibodies, along with appropriate isotype-matched controls. Live cells were gated by exclusion of PI. Results from two independent tissue samples are shown. (D) Sorted populations were transduced overnight with concentrated HIV-eGFP(VSV G) and analyzed 72 h later for enhanced GFP (EGFP) expression, Pyronin Y staining, and Hoechst staining. Quadrant percentages are indicated. Left column, Pyronin Y versus Hoechst; right column, GFP versus Hoechst. Note that for each subpopulation, the S/G2/M population of the transduced cells is two- to fourfold greater than that of the untransduced PHSC. Similar transduction percentages were observed 7 days later.
FIG. 5
FIG. 5
Cells maintained in G0 are poorly transduced compared to actively cycling cells. PHSC were pulse-labelled with CFDA-SE and then cultured in the presence or absence of cytokines. After 48 h, cells were either mock transduced or transduced with concentrated HIV-CD4(VSV G) and then maintained in the presence or absence of cytokines as before. Seventy-two hours later, PHSC were stained with anti-CD4–PE and analyzed by flow cytometry; quadrant percentages are indicated.
FIG. 6
FIG. 6
Poor transduction of G0 PHSC is not improved by immediate rescue with cytokines (CTX). (A) PHSC were maintained in the presence or absence of cytokines for 48 h prior to transduction. Immediately following transduction with concentrated HIV-eGFP(VSV G), all cells were placed into cytokine-containing medium, and 72 h later they were analyzed for enhanced GFP (EGFP) expression. Left column, PI histogram; right column, GFP histogram. Percentages of positive cells are indicated. (B) A separate experiment similar to the one for panel A was performed, except that one population of cells was never exposed to cytokines. After transduction, PHSC were stained for Pyronin Y (PY) and Hoechst 33342 and then analyzed by flow cytometry. Note that PHSC which had been rescued with cytokines were actively cycling, with a majority of cells being Pyronin Y positive, and yet they had a low transduction rate. (C) PHSC maintained in the presence or absence of cytokines for 48 h were mock transduced or transduced with ultracentrifuge-concentrated NL4-3-CMV-AP(VSV G). After transduction, all populations were refed with complete medium containing cytokines and 72 h later were stained overnight for HPAP activity by using BCIP-NBT. Shown are the average percent transductions for two independent experiments. Note that this vector (which contains all of the accessory HIV gene products) poorly transduced G0 PHSC.
FIG. 6
FIG. 6
Poor transduction of G0 PHSC is not improved by immediate rescue with cytokines (CTX). (A) PHSC were maintained in the presence or absence of cytokines for 48 h prior to transduction. Immediately following transduction with concentrated HIV-eGFP(VSV G), all cells were placed into cytokine-containing medium, and 72 h later they were analyzed for enhanced GFP (EGFP) expression. Left column, PI histogram; right column, GFP histogram. Percentages of positive cells are indicated. (B) A separate experiment similar to the one for panel A was performed, except that one population of cells was never exposed to cytokines. After transduction, PHSC were stained for Pyronin Y (PY) and Hoechst 33342 and then analyzed by flow cytometry. Note that PHSC which had been rescued with cytokines were actively cycling, with a majority of cells being Pyronin Y positive, and yet they had a low transduction rate. (C) PHSC maintained in the presence or absence of cytokines for 48 h were mock transduced or transduced with ultracentrifuge-concentrated NL4-3-CMV-AP(VSV G). After transduction, all populations were refed with complete medium containing cytokines and 72 h later were stained overnight for HPAP activity by using BCIP-NBT. Shown are the average percent transductions for two independent experiments. Note that this vector (which contains all of the accessory HIV gene products) poorly transduced G0 PHSC.
FIG. 7
FIG. 7
The block to transduction in G0 cells is at the level of initiation of reverse transcription. PHSC were maintained in the presence or absence of cytokines for 48 h prior to transduction with concentrated HIV-eGFP(VSV G). Immediately after transduction, the PHSC were placed in cytokine-containing medium. Seventy-two hours later, PHSC were sorted on the basis of GFP staining and immediately lysed in PCR buffer. (A) Analysis of integrated products by nested Alu PCR. Lane 1, mock transduction of cells maintained in cytokines; lane 2, PHSC exposed to HIV-eGFP(VSV G) and then cytokine rescued and sorted to be GFP negative; lane 3, HIV-eGFP(VSV G) transduction of PHSC which were maintained in cytokines and sorted to be GFP positive; lane 4, PHSC exposed to HIV-eGFP(VSV G) and then maintained in cytokines and sorted to be GFP negative. PCR products were digested with BspEI, size separated by agarose gel electrophoresis, transferred to a nylon membrane, and hybridized by using an HIV LTR probe as described in the text. Numbers on the right indicate base pairs. (B) Analysis of late reverse transcription products by LTR-Gag PCR (primers NL4-3 171U and NL4-3 831L). Lanes are as for panel A. PCR products were size separated and probed as for panel A. (C) Analysis of early reverse transcription products with R-U5 PCR primers M667 and AA55. Lanes A to F, .3 × 108, 4.3 × 10⁵, 8.5 × 10⁴, 1.7 × 10⁴, 3,400, and 0 copies, respectively. Lane 1, PHSC exposed to HIV-eGFP(VSV G) and then maintained in cytokines and sorted to be GFP negative; lane 2, HIV-eGFP(VSV G) transduction of PHSC which were maintained in cytokines and sorted to be GFP positive; lane 3, PHSC exposed to HIV-eGFP(VSV G) and then cytokine rescued and sorted to be GFP negative; lane 4, mock transduction of cells maintained in cytokines. A total of 2,500 cell equivalents were used in each PCR. Products were size fractionated by horizontal gel electrophoresis and stained with ethidium bromide. The source of the product of approximately 100 bp in lane 4 is unknown but does not hybridize to the HIV LTR. (D) Schematic of the 5′ end of integrated HIV provirus near the human Alu element and PCR primers used in the analyses. 1, primers NL4-3 171U and NL4-3 831L, for late reverse transcription products; 2, primers M667 and AA55 for early reverse transcription products; 3, internal primers NI-2 5′ and NI-2 3′ for nested Alu PCR for integrated products; 4, external primers Alu-LTR 5′ and Alu-LTR 3′ for nested Alu PCR for integrated products (8). B, BspEI site.
FIG. 8
FIG. 8
The block to transduction in G0 PHSC is at a postentry viral step. (A) CD34+ PHSC were maintained in the presence or absence of cytokines (CTX) or rescued with cytokines. The cells were then stained by using the annexin V Fluos kit (Boehringer Mannheim) and PI. Left column, PI histogram; right column, annexin V histogram. The mean cell fluorescence (MCF) for each PI-negative population is indicated. As expected, the PI-positive populations had a higher MCF (not shown). (B) CD34+ PHSC were maintained in the presence or absence of cytokines, labeled with CFDA-SE, and incubated with VSV G-expressing 293T cells. After acid shock (to promote fusion), cells were analyzed by flow cytometry. Left column, histogram of CFDA-SE fluorescence; middle column, forward-scatter (FS) and side-scatter (SS) dot plot of CFDA-SE-positive cells. The R2 gate includes cells that have undergone fusion (higher forward and side scatters). The percentage of cells is indicated. Right column, forward- and side-scatter dot plot of targets alone. Top and bottom rows, 293T cells alone which have and have not undergone fusion, respectively.
FIG. 8
FIG. 8
The block to transduction in G0 PHSC is at a postentry viral step. (A) CD34+ PHSC were maintained in the presence or absence of cytokines (CTX) or rescued with cytokines. The cells were then stained by using the annexin V Fluos kit (Boehringer Mannheim) and PI. Left column, PI histogram; right column, annexin V histogram. The mean cell fluorescence (MCF) for each PI-negative population is indicated. As expected, the PI-positive populations had a higher MCF (not shown). (B) CD34+ PHSC were maintained in the presence or absence of cytokines, labeled with CFDA-SE, and incubated with VSV G-expressing 293T cells. After acid shock (to promote fusion), cells were analyzed by flow cytometry. Left column, histogram of CFDA-SE fluorescence; middle column, forward-scatter (FS) and side-scatter (SS) dot plot of CFDA-SE-positive cells. The R2 gate includes cells that have undergone fusion (higher forward and side scatters). The percentage of cells is indicated. Right column, forward- and side-scatter dot plot of targets alone. Top and bottom rows, 293T cells alone which have and have not undergone fusion, respectively.

References

    1. Aiken C. Pseudotyping human immunodeficiency virus type 1 (HIV-1) by the glycoprotein of vesicular stomatitis virus targets HIV-1 entry to an endocytic pathway and suppresses both the requirement for Nef and the sensitivity to cyclosporin A. J Virol. 1997;71:5871–5877. - PMC - PubMed
    1. Aiken C, Trono D. Nef stimulates human immunodeficiency virus type 1 proviral DNA synthesis. J Virol. 1995;69:5048–5056. - PMC - PubMed
    1. Akkina R K, Walton R M, Chen M L, Li Q X, Planelles V, Chen I S. High-efficiency gene transfer into CD34+ cells with a human immunodeficiency virus type 1-based retroviral vector pseudotyped with vesicular stomatitis virus envelope glycoprotein G. J Virol. 1996;70:2581–2585. - PMC - PubMed
    1. Barankiewicz J, Cohen A. Purine nucleotide metabolism in phytohemagglutin-induced human T lymphocytes. Arch Biochem Biophys. 1987;258:167–175. - PubMed
    1. Blomer U, Naldini L, Kafri T, Trono D, Verma I M, Gage F H. Highly efficient and sustained gene transfer in adult neurons with a lentivirus vector. J Virol. 1997;71:6641–6649. - PMC - PubMed

Publication types

Substances