. 1999 May;73(5):3744-52.
doi: 10.1128/JVI.73.5.3744-3752.1999.

Replicative fitness of protease inhibitor-resistant mutants of human immunodeficiency virus type 1

Affiliations

Replicative fitness of protease inhibitor-resistant mutants of human immunodeficiency virus type 1

J Martinez-Picado et al. J Virol. 1999 May.

Abstract

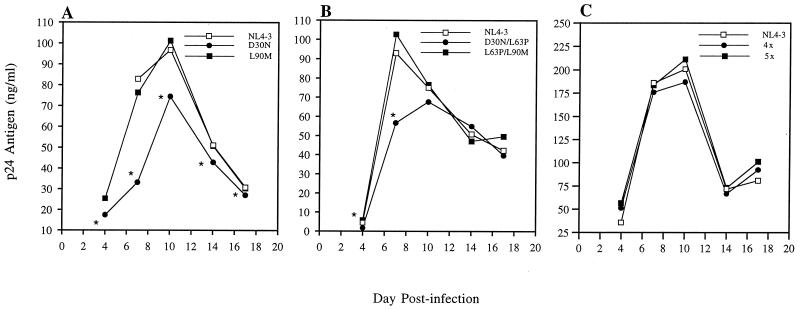
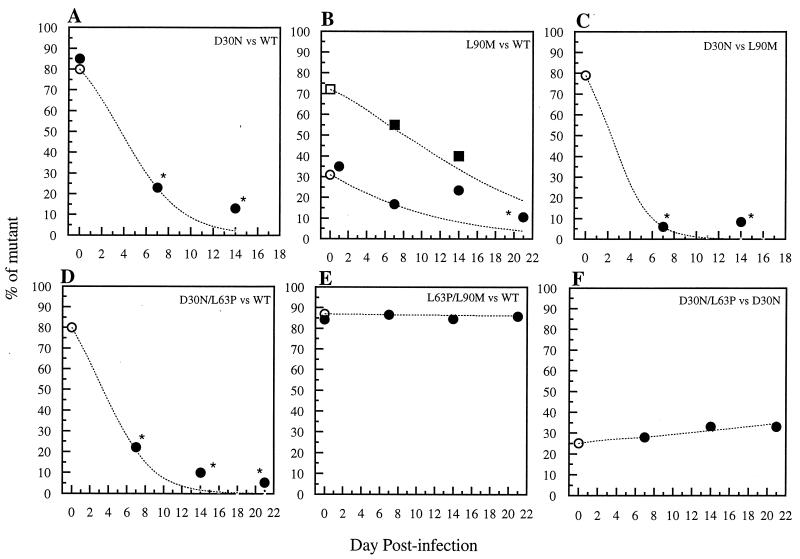
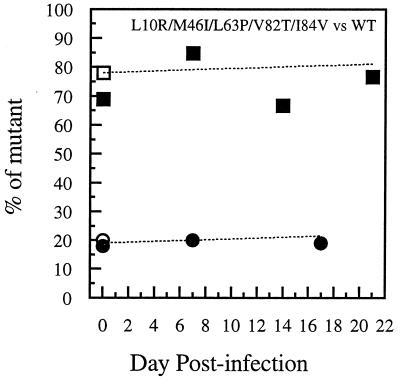
The relative replicative fitness of human immunodeficiency virus type 1 (HIV-1) mutants selected by different protease inhibitors (PIs) in vivo was determined. Each mutant was compared to wild type (WT), NL4-3, in the absence of drugs by several methods, including clonal genotyping of cultures infected with two competing viral variants, kinetics of viral antigen production, and viral infectivity/virion particle ratios. A nelfinavir-selected protease D30N substitution substantially decreased replicative capacity relative to WT, while a saquinavir-selected L90M substitution moderately decreased fitness. The D30N mutant virus was also outcompeted by the L90M mutant in the absence of drugs. A major natural polymorphism of the HIV-1 protease, L63P, compensated well for the impairment of fitness caused by L90M but only slightly improved the fitness of D30N. Multiply substituted indinavir-selected mutants M46I/L63P/V82T/I84V and L10R/M46I/L63P/V82T/I84V were just as fit as WT. These results indicate that the mutations which are usually initially selected by nelfinavir and saquinavir, D30N and L90M, respectively, impair fitness. However, additional mutations may improve the replicative capacity of these and other drug-resistant mutants. Hypotheses based on the greater fitness impairment of the nelfinavir-selected D30N mutant are suggested to explain observations that prolonged responses to delayed salvage regimens, including alternate PIs, may be relatively common after nelfinavir failure.


Figures

FIG. 1
FIG. 1
Replication kinetics of PI-resistant HIV-1 mutants in parallel cultures. One thousand TCID50 of each virus was used per 106 PHA-prestimulated PBMCs (MOI = 0.001). Virus production was monitored at days 4, 7, 10, 14, and 17 by measuring HIV-1 p24 antigen levels in supernatant fluids of triplicate cultures of each virus. The means of p24 antigen values are depicted for each virus over time. (A) D30N versus L90M versus WT; (B) D30N/L63P versus L63P/L90M versus WT; (C) L10R/M46I/L63P/V82T/I84V (5×) versus M46I/L63P/V82T/I84V (4×) versus WT. An asterisk indicates a statistically significant difference (P < 0.05; Mann-Whitney U test).
FIG. 2
FIG. 2
Fitness dynamics based on clonal analysis of mixed competitive infections of MT2 cells with drug-resistant HIV-1 mutants selected by nelfinavir or saquinavir in vivo. Coinfections were carried out with nonequivalent amounts of PI-resistant mutants versus either WT (NL4-3) or another mutant. The proportion of mutant virus, or the first mutant virus listed in the inset caption for each panel, is plotted over time. Two experiments, each initiated with a different proportion of the two viruses, are plotted in panel B; one experiment is plotted in each of the other panels. A mean of 15 clones was analyzed at each time point. (A) D30N versus WT starting with 85% D30N mutant, depicting the percentage of D30N mutant over time; (B) L90M versus WT starting with either 31% (circles) or 72% (squares) L90M mutant, depicting the percentage of L90M mutant over time; (C) D30N versus L90M starting with 80% D30N mutant, depicting the percentage of D30N mutant over time; (D) D30N/L63P versus WT starting with 80% D30N/L63P mutant, depicting the percentage of D30N/L63P mutant over time; (E) L63P/L90M versus WT starting with 87% L63P/L90M mutant, depicting the percentage of L63P/L90M mutant over time; (F) D30N/L63P versus D30N starting with 25% D30N/L63P mutant, depicting the percentage of D30N/L63P over time. Open symbols on day 0 refer to input TCID50 proportions (mutant TCID50/total TCID50). Solid symbols on day 0 refer to proportions of clones determined by clonal genotyping (number of mutant clones/total number of clones). The dotted lines show the percentage of each mutant predicted by a formula that modeled the effects of selection at a single locus in an asexual haploid population during continuous replication in overlapping generations (42) and which has been used in other studies of relative fitness of drug-resistant HIV-1 mutants (16, 22, 57); the relative fitness determined at day 7 was used to solve for proportions at other time points. The time points after day 7 do not agree perfectly with the model’s predictions in cases where the variants differ markedly, suggesting this model is inadequate. The asterisks indicate a statistically significant difference from day 0 (P < 0.05; Fisher’s exact test).
FIG. 3
FIG. 3
Fitness dynamics based on clonal analysis of mixed competitive infections of MT2 cells with a drug-resistant HIV-1 mutant selected by indinavir in vivo versus WT. Coinfections were carried out with nonequivalent amounts of PI-resistant L10R/M46I/L63P/V82T/I84V mutant versus WT (NL4-3). The proportion of mutant virus is plotted over time. Two experiments, each initiated with a different proportion of the two viruses, are plotted. A mean of 15 clones was analyzed at each time point of the culture of L10R/M46I/L63P/V82T/I84V mutant versus WT starting with either 20% (circles) or 80% (squares) of the L10R/M46I/L63P/V82T/I84V mutant; the percentage of L10R/M46I/L63P/V82T/I84V mutant is depicted over time. Open symbols on day 0 refer to input TCID50 proportions (mutant TCID50/total TCID50). Solid symbols on day 0 refer to proportions of clones determined by clonal genotyping (number of mutant clones/total number of clones). The dotted lines show the percentage of the mutant predicted by a formula (42) used in several other studies of the relative fitness of drug-resistant HIV-1 mutants (16, 22, 57); the relative fitness determined at day 7 was used to solve for proportions at other time points.

References

    1. Adachi A, Gendelman H E, Koening S, Folks T, Willey R, Rabson A, Martin M A. Production of acquired immunodeficiency syndrome-associated retrovirus in human and non-human cells transfected with an infectious molecular clone. J Virol. 1986;59:284–291. - PMC - PubMed
    1. Back N K, Nijhuis M, Keulen W, Boucher C A, Oude Essink B O, van Kuilenburg A B, van Gennip A H, Berkhout B. Reduced replication of 3TC-resistant HIV-1 variants in primary cells due to a processivity defect of the reverse transcriptase enzyme. EMBO J. 1996;15:4040–4049. - PMC - PubMed
    1. Blaak H, Brouwer M, Ran L J, Wolf F, Schuitemaker H. In vitro replication kinetics of human immunodeficiency virus type 1 (HIV-1) variants in relation to virus load in long-term survivors of HIV-1 infection. J Infect Dis. 1998;177:600–610. - PubMed
    1. Borman A M, Paulous S, Clavel F. Resistance of human immunodeficiency virus type 1 to protease inhibitors: selection of resistance mutations in the presence and absence of the drug. J Gen Virol. 1996;77:419–426. - PubMed
    1. Boucher C A, van Leeuwen R, Kellam P, Schipper P, Tijnagel J, Lange J M, Larder B A. Effects of discontinuation of zidovudine treatment on zidovudine sensitivity of human immunodeficiency virus type 1 isolates. Antimicrob Agents Chemother. 1993;37:1525–1530. - PMC - PubMed

Publication types