. 1999 May;73(5):3764-77.
doi: 10.1128/JVI.73.5.3764-3777.1999.

Host-specific modulation of the selective constraints driving human immunodeficiency virus type 1 env gene evolution

Affiliations

Host-specific modulation of the selective constraints driving human immunodeficiency virus type 1 env gene evolution

P Bagnarelli et al. J Virol. 1999 May.

Abstract

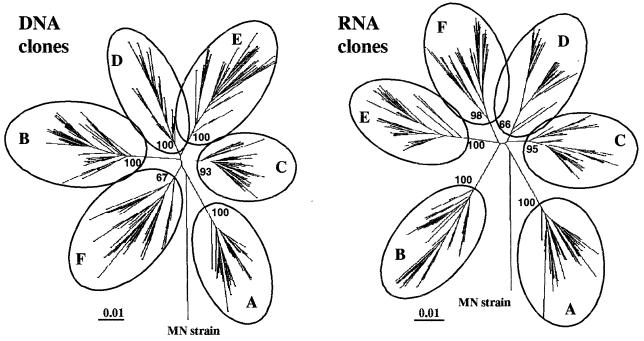
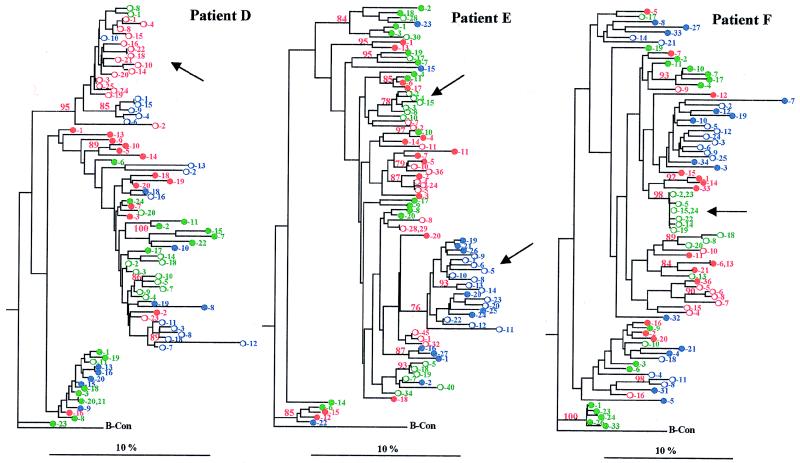
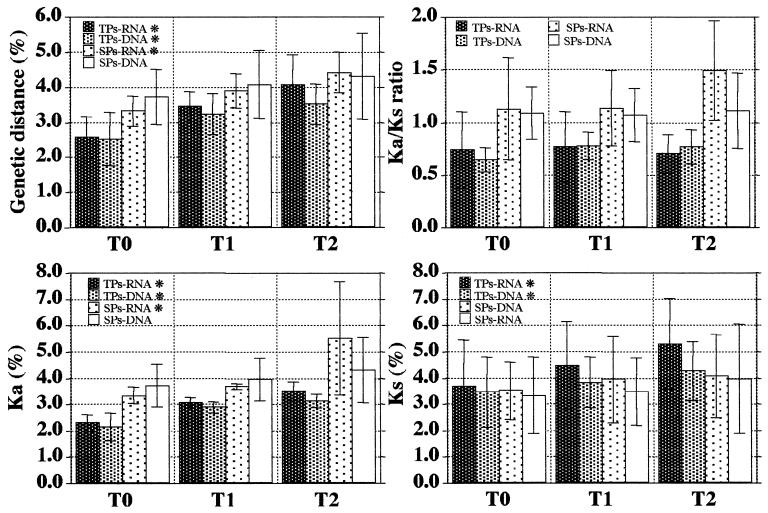
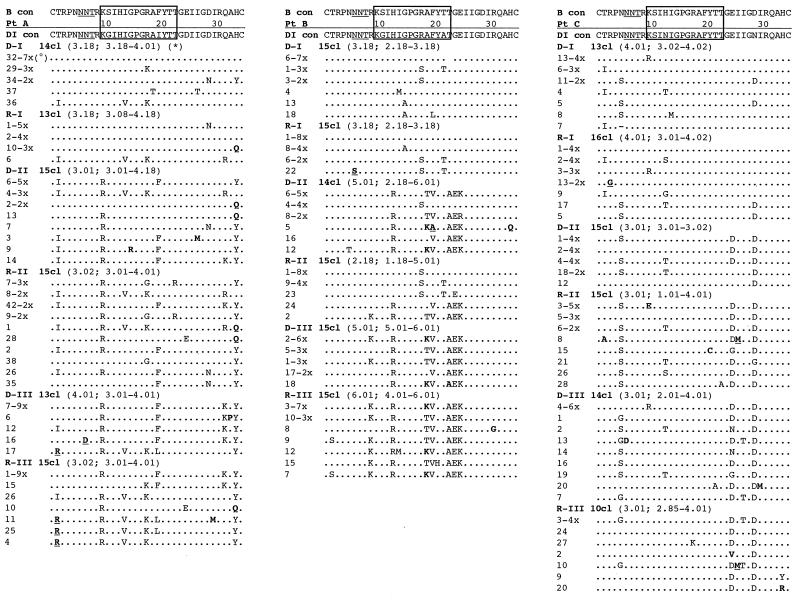
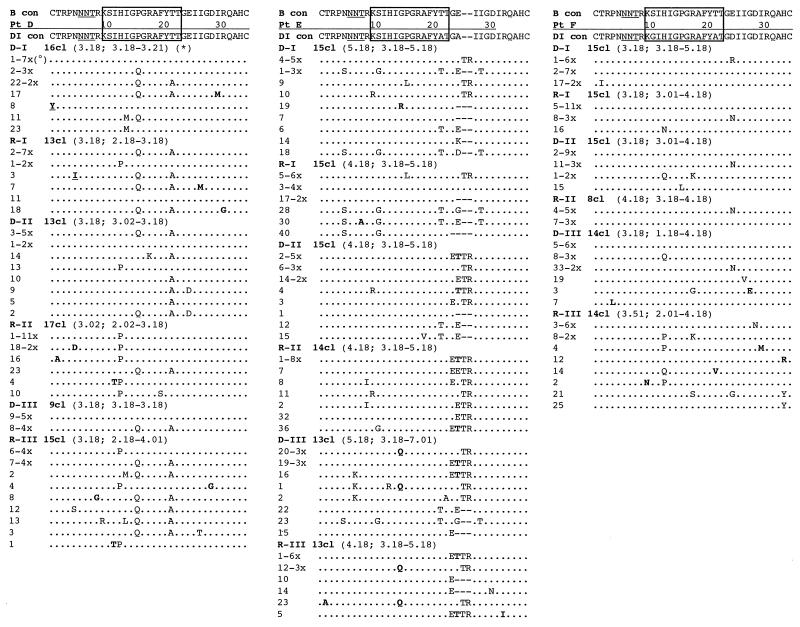
To address the evolution of human immunodeficiency virus type 1 (HIV-1) within a single host, we analyzed the HIV-1 C2-V5 env regions of both cell-free genomic-RNA- and proviral-DNA-derived clones. Sequential samples were collected over a period of 3 years from six untreated subjects (three typical progressors [TPs] and three slow progressors [SPs], all with a comparable length of infection except one. The evolutionary analysis of the C2-V5 env sequences performed on 506 molecular clones (253 RNA- and 253 DNA-derived sequences) highlighted a series of differences between TPs and SPs. In particular, (i) clonal sequences from SPs (DNA and RNA) showed lower nucleotide similarity than those from TPs (P = 0. 0001), (ii) DNA clones from SPs showed higher intra- and intersample nucleotide divergence than those from TPs (P < 0.05), (iii) higher host-selective pressure was generally detectable in SPs (DNA and RNA sequences), and (iv) the increase in the genetic distance of DNA and RNA sequences over time was paralleled by an increase in both synonymous (Ks) and nonsynonymous (Ka) substitutions in TPs but only in nonsynonymous substitutions in SPs. Several individual peculiarities of the HIV-1 evolutionary dynamics emerged when the V3, V4, and V5 env regions of both TPs and SPs were evaluated separately. These peculiarities, probably reflecting host-specific features of selective constraints and their continuous modulation, are documented by the dynamics of Ka/Ks ratios of hypervariable env domains.


Figures

FIG. 1
FIG. 1
Phylogenetic trees of HIV-1 env C2-V5 DNA and RNA nucleotide sequences. Phylogenetic analysis of all viral sequences (253 from proviral DNA and 253 from plasma RNA) was performed by feeding the Kimura two-parameter distance matrix into the neighbor-joining tree. Distinct clusters of viral sequences corresponding to each subject were found, indicating the absence of cross-contamination. The HIV-1 MN strain was used as prototype of clade-B env sequences. Branch lengths are drawn to scale. Bootstrap proportions are shown in the appropriate branch point.
FIG. 2
FIG. 2
Phylogenetic reconstruction of the evolutionary relationships within the six subjects. The deduced amino acid sequence of all proviral and cell-free genomic RNA clones were analyzed along with the B-clade consensus as the outgroup by using the Kimura’s formula distance matrix fed into the neighbor-joining tree construction algorithm. Bootstrap proportions greater than 75 of 100 bootstrap replicates are shown in the appropriate branch point. Branch lengths are drawn to scale. Sequences from TPs (patients A to C) are less divergent than those from SPs (patients D to F), as demonstrated by the scale bar. Specific clusters of viral variants in SPs, which are characteristic of RNA clones, are indicated by arrows. A major cluster of viral variants in patient B (arrow) is characterized by major amino acid changes in the V3 loop. The different samples are indicated in color: green (first), red (second), and blue (third). The clone number is reported close to the symbols. The plasma-derived sequences (○) and provirus-derived sequences (●) are indicated.
FIG. 2
FIG. 2
Phylogenetic reconstruction of the evolutionary relationships within the six subjects. The deduced amino acid sequence of all proviral and cell-free genomic RNA clones were analyzed along with the B-clade consensus as the outgroup by using the Kimura’s formula distance matrix fed into the neighbor-joining tree construction algorithm. Bootstrap proportions greater than 75 of 100 bootstrap replicates are shown in the appropriate branch point. Branch lengths are drawn to scale. Sequences from TPs (patients A to C) are less divergent than those from SPs (patients D to F), as demonstrated by the scale bar. Specific clusters of viral variants in SPs, which are characteristic of RNA clones, are indicated by arrows. A major cluster of viral variants in patient B (arrow) is characterized by major amino acid changes in the V3 loop. The different samples are indicated in color: green (first), red (second), and blue (third). The clone number is reported close to the symbols. The plasma-derived sequences (○) and provirus-derived sequences (●) are indicated.
FIG. 3
FIG. 3
Dynamics of HIV-1 evolutionary parameters in TP and SP subjects. Bars represent the mean values ± the standard deviations of the genetic distance, antonymous (Ka) and synonymous (Ks) substitutions, and Ka/Ks ratio (see Table 3) relative to subjects grouped for the clinical status (TPs and SPs) and nucleic acid sequenced (RNA and DNA) at the three time points (T0, T1, and T2). Asterisks close to the group’s symbol indicate that the rate of increase over time reaches the significant level of 5% for that group (Friedman test).
FIG. 4
FIG. 4
Dynamic features of the selective forces on the complete HIV-1 C2-V5 env sequence and on the hypervariable regions V3, V4, and V5 within each subject. Intratime (first sample) and intertime (second and third samples) Ka/Ks values were plotted for the complete C2-V5 sequence of HIV-1 gp120, and the V3, V4, and V5 regions were analyzed separately. The data are shown as positive or negative histograms starting from Ka/Ks = 1. Sample points are indicated by white (first), shaded (second), and black (third) bars.
FIG. 5
FIG. 5
Deduced amino acid sequence alignments of the V3 loop from the six subjects. The B-clade consensus sequence reported above each alignment shows the most common amino acid found in each position among 1,078 viral variants (see reference 49). The sequences from each subject are aligned with the majority consensus sequence from the first proviral sample (DI con) at the top of each alignment. The clinical sample from which the sequences were derived, i.e., proviral DNA or plasma RNA, are indicated as D or R, respectively. The serial time points are indicated by Roman numbers, and the actual number of clones sequenced within each sample is indicated by a number followed by “cl” (clones). The deduced amino acid sequences are identified by the clone number. Dots indicate identity with the reference sequence, while dashes represent gaps introduced to maintain the alignment. Underlined residues indicate unique variants not identified before, and residues in boldface indicate vary rare variants (<0.5%). The box at the top of each alignment identifies the principal neutralization domain; the N-linked glycosylation site is underlined. Symbols: *, median net charge and range at physiological pH; °, frequency of clones with identical amino acid sequences.
FIG. 5
FIG. 5
Deduced amino acid sequence alignments of the V3 loop from the six subjects. The B-clade consensus sequence reported above each alignment shows the most common amino acid found in each position among 1,078 viral variants (see reference 49). The sequences from each subject are aligned with the majority consensus sequence from the first proviral sample (DI con) at the top of each alignment. The clinical sample from which the sequences were derived, i.e., proviral DNA or plasma RNA, are indicated as D or R, respectively. The serial time points are indicated by Roman numbers, and the actual number of clones sequenced within each sample is indicated by a number followed by “cl” (clones). The deduced amino acid sequences are identified by the clone number. Dots indicate identity with the reference sequence, while dashes represent gaps introduced to maintain the alignment. Underlined residues indicate unique variants not identified before, and residues in boldface indicate vary rare variants (<0.5%). The box at the top of each alignment identifies the principal neutralization domain; the N-linked glycosylation site is underlined. Symbols: *, median net charge and range at physiological pH; °, frequency of clones with identical amino acid sequences.

References

    1. Bagnarelli P, Menzo S, Valenza A, Manzin A, Giacca M, Ancarani F, Scalise G, Varaldo P E, Clementi M. Molecular profile of human immunodeficiency virus type 1 infection in symptomless patients and in patients with AIDS. J Virol. 1992;66:7328–7335. - PMC - PubMed
    1. Bagnarelli P, Valenza A, Menzo S, Sampaolesi R, Varaldo P E, Butini L, Montroni M, Perno C-F, Aquaro S, Mathez D, Leibowitch J, Balotta C, Clementi M. Dynamics and modulation of human immunodeficiency type 1 transcripts in vitro and in vivo. J Virol. 1996;70:7603–7613. - PMC - PubMed
    1. Bakhanashvili M, Hizi A. Fidelity of the reverse transcriptase of human immunodeficiency type 2. FEBS Lett. 1992;306:151–156. - PubMed
    1. Bakhanashvili M, Hizi A. The fidelity of the reverse transcriptases of human immunodeficiency viruses and murine leukemia virus exhibited by the mispair extension frequencies is sequence dependent and enzyme related. FEBS Lett. 1993;319:201–205. - PubMed
    1. Bebenek K, Abbotts J, Wilson S H, Kunkel T A. Error-prone polymerization by HIV-1 reverse transcriptase. Contribution of template-primer misalignment miscoding and termination probability to mutational hot spots. J Biol Chem. 1993;268:10324–10334. - PubMed

Publication types

Associated data