. 1999 Apr;181(8):2385-93.
doi: 10.1128/JB.181.8.2385-2393.1999.

Transcriptional organization of the czc heavy-metal homeostasis determinant from Alcaligenes eutrophus

Affiliations

Transcriptional organization of the czc heavy-metal homeostasis determinant from Alcaligenes eutrophus

C Grosse et al. J Bacteriol. 1999 Apr.

Abstract

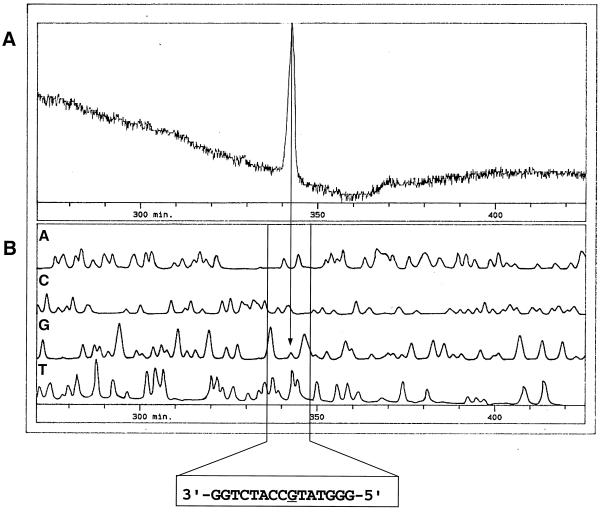
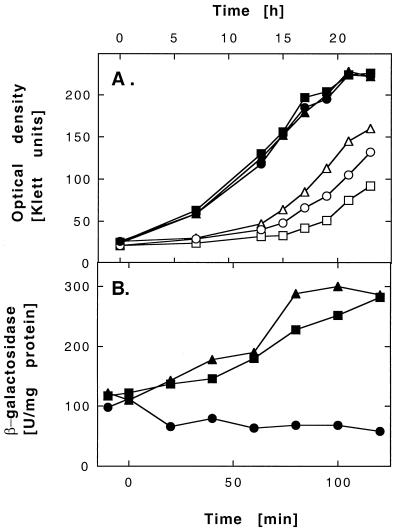
The Czc system of Alcaligenes eutrophus mediates resistance to cobalt, zinc, and cadmium through ion efflux catalyzed by the CzcCB2A cation-proton antiporter. DNA sequencing of the region upstream of the czcNICBADRS determinant located on megaplasmid pMOL30 revealed the 5' end of czcN and a gene for a MgtC-like protein which is transcribed in the orientation opposite that of czc. Additional open reading frames upstream of czc had no homologs in the current databases. Using oligonucleotide-probed Northern blotting experiments, a 500-nucleotide czcN message and a 400-nucleotide czcI message were found, and the presence of 6, 200-nucleotide czcCBA message (D. Van der Lelie et al., Mol. Microbiol. 23:493-503, 1997) was confirmed. Induction of czcN, czcI, czcCBA, and czcDRS followed a similar pattern: transcription was induced best by 300 microM zinc, less by 300 microM cobalt, and only slightly by 300 microM cadmium. Reverse transcription-PCR gave evidence for additional continuous transcription from czcN to czcC and from czcD to czcS, but not between czcA and czcD nor between czcS and a 131-amino-acid open reading frame following czcS. The CzcR putative response regulator was purified and shown to bind in the 5' region of czcN. A reporter strain carrying a czcNIC-lacZ-czcBADRS determinant on plasmid pMOL30 was constructed, as were DeltaczcR and DeltaczcS mutants of this strain and of AE128(pMOL30) wild type. Experiments on (i) growth of these strains in liquid culture containing 5 mM Zn2+, (ii) induction of the beta-galactosidase in the reporter strains by zinc, cobalt, and cadmium, and (iii) cDNA analysis of czcCBA mRNA synthesis under inducing and noninducing conditions showed that the CzcRS two-component regulatory system is involved in Czc regulation.


Figures

FIG. 1
FIG. 1
The czc determinant and its transcripts. A physical map of the czcNICBADRS determinant, mgtC, and ORF131 is shown; differences in shading indicate the different genes. The czc genes and the two ORFs (shown above the line) are transcribed from left to right; mgtC (below the line) is transcribed from right to left. A scaled-up view of the czcN upstream region is shown at the upper left. K, E, and X indicate sites for the restriction endonucleases KpnI, EcoRI, and XhoI, respectively. An arrow in front of czcN points to the binding site of the CzcR response regulator; the three lines under czcN indicate positions of the DNA fragments a, b, and c used in gel retardation experiments with CzcR. The figure is drawn to the scale given in kilobase pairs; the left scale represents the 2.879-kb czcN upstream region (gpAJ001159), and the right scale represents the previously published 11.3-kb czc sequence (gbX98451 [35]). The open circles above the physical map are potential rho-independent terminators (stem-loops followed by U stretches) with free energies of −60 kJ/mol (czcIt), −97 kJ/mol (czcAt), and −66 kJ/mol (czcSt), respectively. Closed circles below the line are the 5′ ends of the czcI-, czcC-, and czcD-specific mRNAs (primer extension results). The bar labeled “T7 fragment” shows the size, position, and orientation compared to the T7 promoter (black arrowhead) of the czc region used for T7 expression. The four black horizontal arrows pointing from left to right mark positions of the four czc-specific mRNAs (oligonucleotide-probed Northern blots); the arrow for the czcDRS-specific message is dashed because the size of the transcript could not be measured. The lines with two arrowheads mark positions of RT-PCR-generated fragments; two dashed lines with crosses are in regions where no RT-PCR fragment could be obtained. The dumbbell below czcA shows the position of the 529-bp fragment resulting from the competitive (Comp.) RT-PCR experiments. Finally, the dashed arrows at the bottom indicate all hypothetical transcripts of czc which yield the mRNAs observed in the Northern and RT-PCR experiments: czcNICBA (from czcNp to czcAt), czcICBA (from czcIp to czcAt), czcCBA (from czcCp to czcAt), czcDRS (from czcDp to czcSt), czcNI (from czcNp to czcIt), and czcI (from czcIp to czcIt), with the four assumed promoters czcNp, czcIp, czcCp, and czcDp.
FIG. 2
FIG. 2
Oligonucleotide-probed Northern blot analysis of transcription of the czc determinant. Total RNA was separated by electrophoresis in 1.5% agarose, transferred to a nylon filter, and hybridized with a czcI-specific probe (panel A, all lanes; panel B, lane 6 [for simplicity, lane B6]) or a czcN-specific probe (lane B8; panel C, all lanes). Total RNA was isolated from the czc-free, metal-sensitive strain A. eutrophus AE104 (lanes A5 and C13) and the czc-containing strain AE128 which was cultivated without toxic concentrations of heavy-metal cations (lanes A4 and C12), or induced with metal cations for 10 min: 300 μM Cd2+ (lanes A1 and C9), 300 μM Zn2+ (lanes A2, B6, B8, and C10), or 300 μM Co2+ (lane A3 and C11). Lane B7 is empty. In panel B, the RNA for future hybridization with the czcI- or czcN-specific probe was run on the same gel for direct size comparison. The sizes of RNA molecular size markers are marked with closed arrows; the transcripts are marked with dashed arrows. Blebs and compressions at 1,541 and 2,904 nt are due to the 16S and 23S rRNAs; positions of the rRNAs are marked by large arrowheads. The original photograph was scanned with Ofoto 2.0 (Light Source Computer Images, Inc.) and processed with Adobe Photoshop 3.0 (Adobe Systems, Inc.).
FIG. 3
FIG. 3
Synthesis of [35S]methionine-labeled polypeptides determined by the czcNICB′ region. The upstream region of czc containing czcNICB′ (grey bar labeled “T7 fragment” in Fig. 1) was cloned into plasmid pT7-5 (32a) and expressed in E. coli K38(pGP1-2) (33). (A) Control without the region; (B) czcNICB′ region. Size markers are given in kilodaltons on the left; the resulting polypeptides are indicated by arrows on the right. The original photograph was scanned with Ofoto 2.0 (Light Source Computer Images, Inc.) and processed with Adobe Photoshop 3.0 (Adobe Systems, Inc.).
FIG. 4
FIG. 4
Determination of the transcription initiation site of czcC by primer extension analysis. A. eutrophus AE128(pMOL30) cells were induced for 10 min with 300 μM Zn2+, and total RNA was isolated. Primer extension analyses were performed on an automated fluorescence DNA sequencer using this total RNA and a fluorescently labeled oligonucleotide as the primer (A). Dideoxy sequencing was run as a size marker with the same primer (B); the raw data output is shown, with lines A, C, G, and T representing the successively detected dideoxynucleotide sequencing reaction products. The arrow marks the initiation site at a G. The DNA sequence shown is in the 3′-5′ orientation; the G initiation site is underlined.
FIG. 5
FIG. 5
Binding of CzcR to the DNA region upstream of czcN. Two PCR fragments (fr.) containing overlapping parts of the czcN upstream region were isolated, labeled with 32P, and used in gel retardation experiments with the CzcR protein. The left ends of both fragments, the 389-bp (lanes 1 to 5) and 501-bp (lanes 6 to 10) fragments were the EcoRI site between mgtC and czcN (Fig. 1). The DNA fragments were incubated without CzcR (negative control; lanes 1 and 6), with CzcR (lanes 2 and 7), with CzcR and acetyl phosphate (lanes 3 and 8), with CzcR and a 50-fold excess of unlabeled DNA fragment (lanes 4 and 9), and with CzcR and a 10-fold excess of unlabeled DNA fragment (lanes 5 and 10). The autoradiograms were scanned with Ofoto 2.0 (Light Source Computer Images, Inc.) and processed with Adobe Photoshop 3.0 (Adobe Systems, Inc.).
FIG. 6
FIG. 6
Additional transcripts of czc. DNA-free RNA was isolated from zinc-induced cells of A. eutrophus AE128(pMOL30). The RNA was reverse transcribed by using 3′ antisense (antis.) primers. The resulting cDNA was amplified with the same primer and a 5′ sense primer. The resulting PCR fragments were analyzed on an agarose gel. The genes or ORFs in which the primers are located are indicated above the gel image, and their positions are indicated in Fig. 1. The gel image was inverted with Adobe Photoshop 3.0 (Adobe Systems, Inc.); thus, the ethidium bromide-mediated fluorescence image is shown black on white. Lane 1, czcI-ORF69a; lane 2, czcI-czcN; lane 3, czcC-czcI; lane 4, czcD-czcA; lane 5, 100-bp ladder (sizes indicated on the left); lane 6, czcR-czcD; lane 7, czcS-czcR; lane 8, czcS-czcD; lane 9, ORF131-czcS. Locations of the antisense primers are given first for each pair.
FIG. 7
FIG. 7
Influence of CzcR and CzcS on growth and Czc expression in the presence of zinc. (A) Cells of strains AE128(pMOL30) (●, ○), DN178(pMOL30-10 ΔczcR) (■, □), and DN179(pMOL30-11 ΔczcS) (▴, ▵) were cultivated for 24 h in the presence of 300 μM Zn2+ (■, ●, ▴) or without inducer (□, ○, ▵) and diluted into fresh medium containing 5 mM Zn2+ up to an optical density of 10 Klett units. The cells were incubated with shaking at 30°C, and the increase in optical density was determined. (B) Cells of strains DN175(pMOL30-9 czcNIC lacZ czcBADRS) (●), DN180(pMOL30-12 czcNIC lacZ czcBAD ΔczcR czcS) (■), and DN181(pMOL30-13 czcNIC lacZ czcBADR ΔczcS) (▴) were cultivated for 48 h in Tris-buffered mineral salts medium containing 0.2% (wt/vol) sodium gluconate as the carbon source at 30°C with shaking. The cell suspension was diluted to an optical density of 35 Klett units, incubated with shaking until an optical density of 70 Klett units was reached, and induced with 100 μM Cd2+ at time zero. Incubation was continued with shaking at 30°C. The turbidity of the cells and the β-galactosidase activity of the reporter gene product over time were determined and used to calculate the specific activity in units per milligram (dry weight).

References

    1. Bradford M M. A rapid and sensitive method for the quantitation of microgram quantities of protein utilizing the principle of protein-dye binding. Anal Biochem. 1976;72:248–254. - PubMed
    1. De Las Penas A, Connolly L, Gross C A. The sigmaE-mediated response to extracytoplasmic stress in Escherichia coli is transduced by RseA and RseB, two negative regulators of sigmaE. Mol Microbiol. 1997;24:373–385. - PubMed
    1. Diels L, Dong Q, van der Lelie D, Baeyens W, Mergeay M. The czc operon of Alcaligenes eutrophus CH34: from resistance mechanism to the removal of heavy metals. J Ind Microbiol. 1995;14:142–153. - PubMed
    1. Dressler C, Kües U, Nies D H, Friedrich B. Determinants encoding multiple metal resistance in newly isolated copper-resistant bacteria. Appl Environ Microbiol. 1991;57:3079–3085. - PMC - PubMed
    1. Engler-Blum G, Meier M, Frank J, Müller G A. Reduction of background problems in nonradioactive Northern and Southern blot analysis enables higher sensitivity than 32P-based hybridizations. Anal Biochem. 1993;210:235–244. - PubMed

Publication types

Associated data

LinkOut - more resources