. 1999 Apr;10(4):1093-104.
doi: 10.1091/mbc.10.4.1093.

Epigallocathechin-3 gallate selectively inhibits the PDGF-BB-induced intracellular signaling transduction pathway in vascular smooth muscle cells and inhibits transformation of sis-transfected NIH 3T3 fibroblasts and human glioblastoma cells (A172)

Affiliations
Free PMC article

Epigallocathechin-3 gallate selectively inhibits the PDGF-BB-induced intracellular signaling transduction pathway in vascular smooth muscle cells and inhibits transformation of sis-transfected NIH 3T3 fibroblasts and human glioblastoma cells (A172)

H Y Ahn et al. Mol Biol Cell. 1999 Apr.
Free PMC article

Abstract

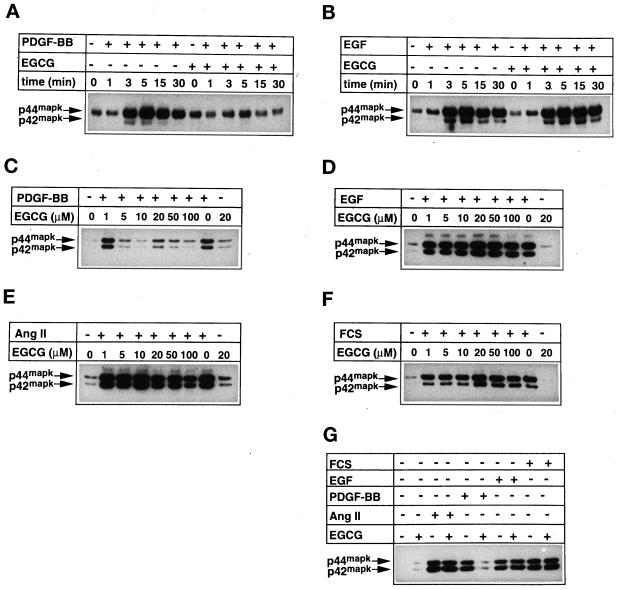
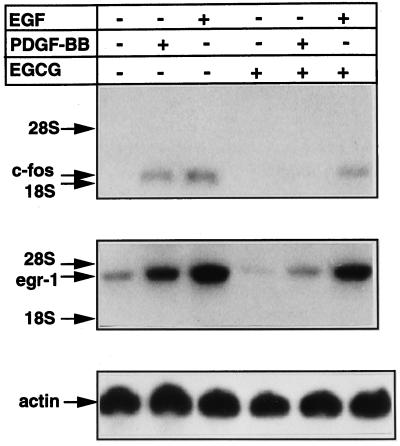
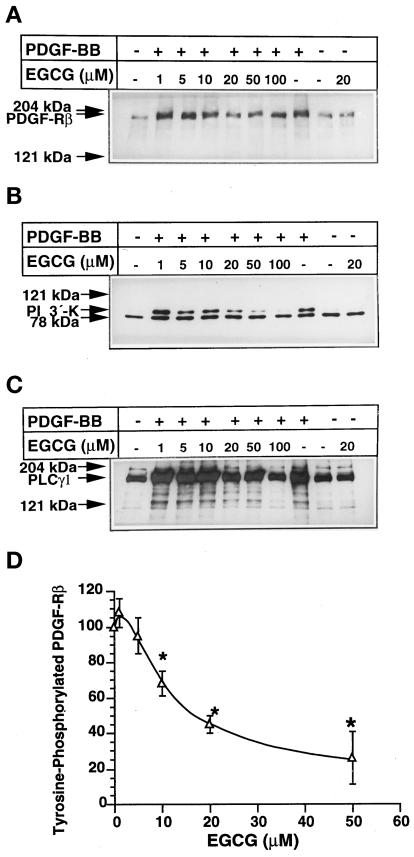
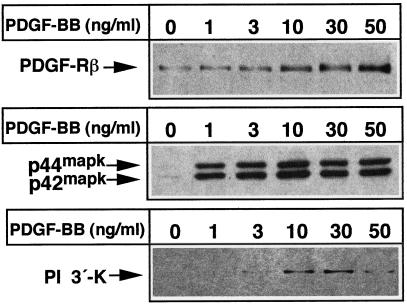
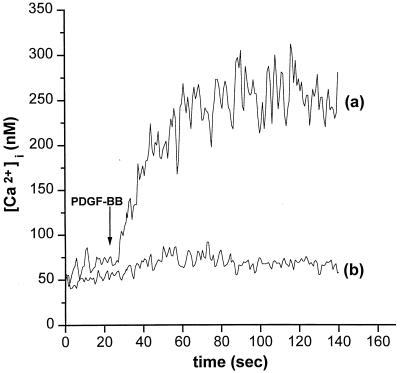
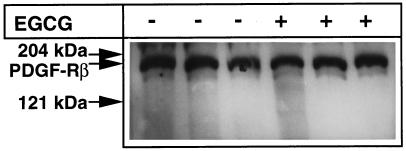
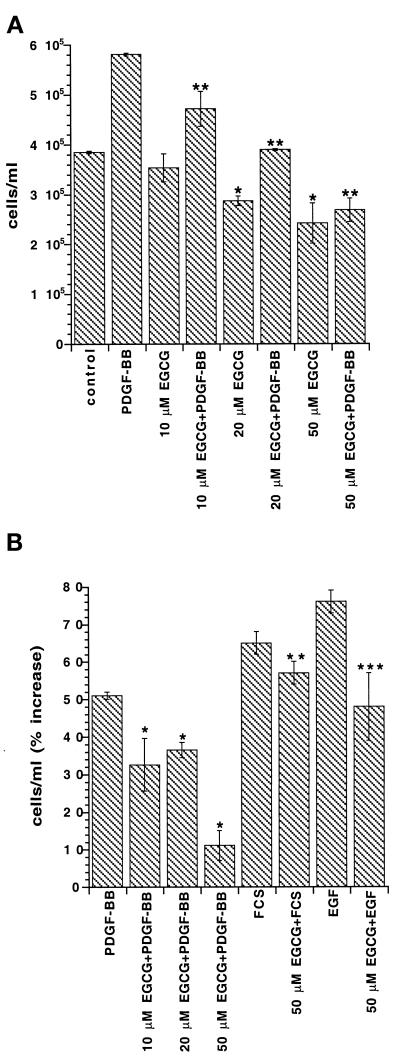
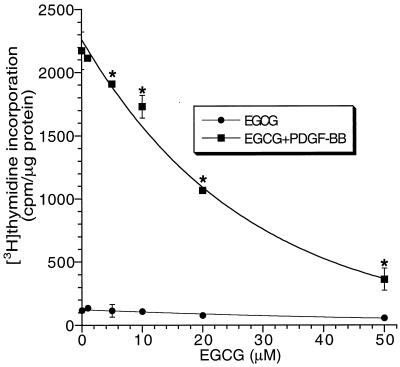
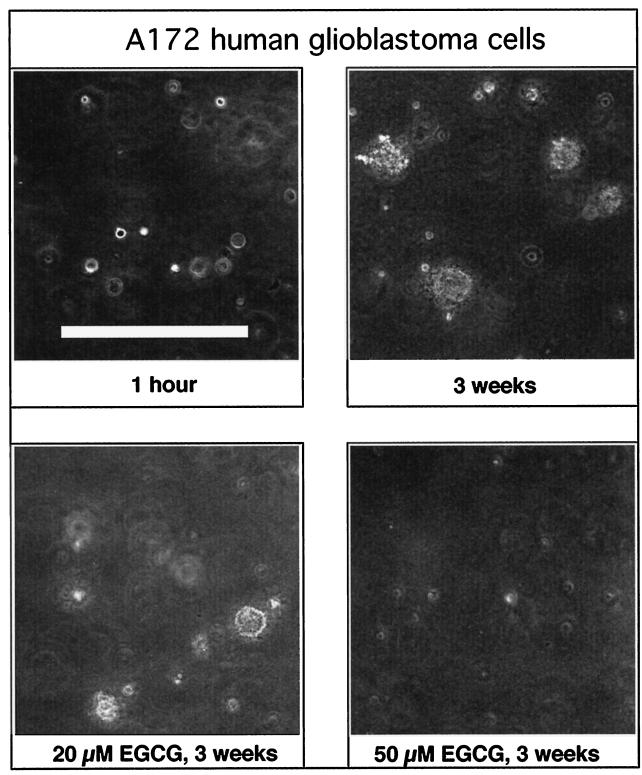
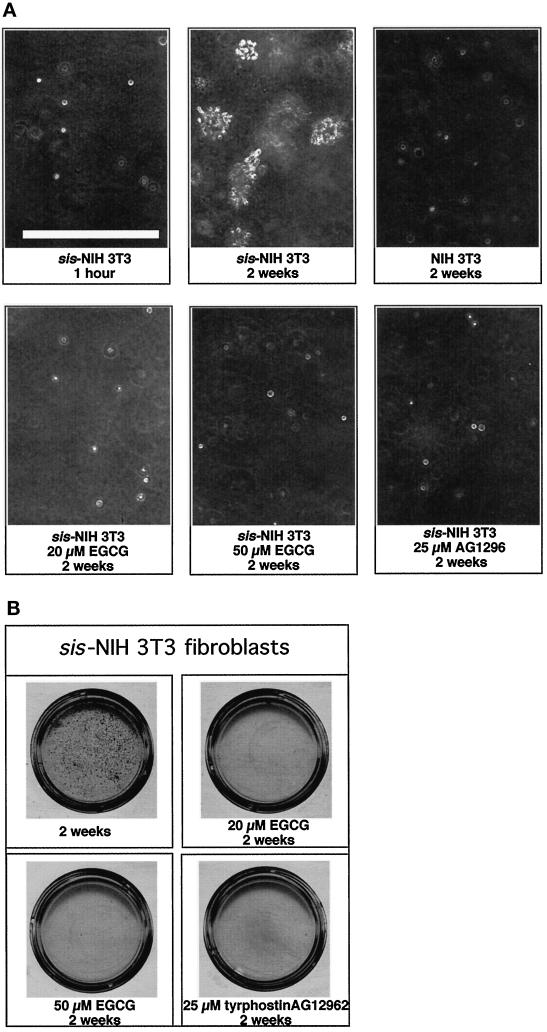
Enhanced activity of receptor tyrosine kinases such as the PDGF beta-receptor and EGF receptor has been implicated as a contributing factor in the development of malignant and nonmalignant proliferative diseases such as cancer and atherosclerosis. Several epidemiological studies suggest that green tea may prevent the development of cancer and atherosclerosis. One of the major constituents of green tea is the polyphenol epigallocathechin-3 gallate (EGCG). In an attempt to offer a possible explanation for the anti-cancer and anti-atherosclerotic activity of EGCG, we examined the effect of EGCG on the PDGF-BB-, EGF-, angiotensin II-, and FCS-induced activation of the 44 kDa and 42 kDa mitogen-activated protein (MAP) kinase isoforms (p44(mapk)/p42(mapk)) in cultured vascular smooth muscle cells (VSMCs) from rat aorta. VSMCs were treated with EGCG (1-100 microM) for 24 h and stimulated with the above mentioned agonists for different time periods. Stimulation of the p44(mapk)/p42(mapk) was detected by the enhanced Western blotting method using phospho-specific MAP kinase antibodies that recognized the Tyr204-phosphorylated (active) isoforms. Treatment of VSMCs with 10 and 50 microM EGCG resulted in an 80% and a complete inhibition of the PDGF-BB-induced activation of MAP kinase isoforms, respectively. In striking contrast, EGCG (1-100 microM) did not influence MAP kinase activation by EGF, angiotensin II, and FCS. Similarly, the maximal effect of PDGF-BB on the c-fos and egr-1 mRNA expression as well as on intracellular free Ca2+ concentration was completely inhibited in EGCG-treated VSMCs, whereas the effect of EGF was not affected. Quantification of the immunoprecipitated tyrosine-phosphorylated PDGF-Rbeta, phosphatidylinositol 3'-kinase, and phospholipase C-gamma1 by the enhanced Western blotting method revealed that EGCG treatment effectively inhibits tyrosine phosphorylation of these kinases in VSMCs. Furthermore, we show that spheroid formation of human glioblastoma cells (A172) and colony formation of sis-transfected NIH 3T3 cells in semisolid agar are completely inhibited by 20-50 microM EGCG. Our findings demonstrate that EGCG is a selective inhibitor of the tyrosine phosphorylation of PDGF-Rbeta and its downstream signaling pathway. The present findings may partly explain the anti-cancer and anti-atherosclerotic activity of green tea.


Figures

Figure 1
Figure 1
Effect of growth factors on the phosphorylation of the p44mapk/p42mapk at Tyr 204 in EGCG pretreated VSMCs. (A) VSMCs were cultured in dishes (diameter: 3 cm) and cultivated until confluence. Then the medium was replaced by serum-free medium containing 50 μM EGCG. After 24 h the medium was replaced by serum-free medium without EGCG, and VSMCs were stimulated with PDGF-BB (A) and EGF (B) for different time periods. VSMCs were pretreated with different concentrations of EGCG and then stimulated for 5 min with 50 ng/ml PDGF-BB (C), 100 nM Ang II (E), 50 ng/ml EGF (D), and 5% FCS (F). EGCG-treated VSMCs were stimulated with 50 ng/ml PDGF-BB, 100 nM Ang II, and 50 ng/ml EGF for 5 min. (G) Cells were treated with 50 μM EGCG for 24 h and then stimulated with 50 ng/ml PDGF-BB, 50 ng/ml EGF, 100 nM Ang II, and 5% FCS for 5 min. Cells were lysed, and 20 μg of protein were analyzed with SDS-PAGE. MAP kinase was detected after blotting on polyvinylidene difluoride membranes by a specific MAP kinase antibody that recognizes the catalytically activated p44mapk/p42mapk. Cells were stimulated with 50 ng/ml PDGF-BB, 100 nM Ang II, and 50 ng/ml EGF for 5 min.
Figure 2
Figure 2
Effect of PDGF-BB and EGF on the expression of c-fos and egr-1 mRNA in EGCG-treated VSMCs. Confluent cells in 75-cm2 flasks were precultured in the presence and absence of 50 μM EGCG in serum-free medium for 24 h. Then medium was replaced with serum-free medium without EGCG, and VSMCs were stimulated with 50 ng/ml PDGF-BB and 50 ng/ml EGF for 30 min. Ten micrograms of total RNA were electrophoresed on formaldehyde–agarose gels, blotted onto Hybond N+ membranes, and probed with a 32P-labeled 1.0-kb v-fos cDNA probe that hybridized to the 2.2-kb mRNA of c-fos. The same blot was rehybridized with a 32P-labeled 2.1-kb egr-1 cDNA probe that hybridized to the 3.4-kb egr-1 mRNA and with a 0.77-kb cDNA probe for β-actin mRNA. Arrows show the 28S (4.6 kb), the 18S rRNA (1.8 kb), the 2.2-kb c-fos mRNA, and the 2.0-kb β-actin mRNA.
Figure 3
Figure 3
Effect of PDGF-BB on tyrosine phosphorylation of PDGF-Rβ, PI 3′-K, and PLC-γ1 in EGCG-treated VSMCs. Confluent cells in 75-cm2 flasks were preincubated in serum-free medium in the presence and absence of different concentrations of EGCG. Then the medium was replaced with serum-free medium without EGCG, and VSMCs were stimulated with 50 ng/ml PDGF-BB for 5 min. Then the cells were lysed, and tyrosine-phosphorylated proteins were immunoprecipitated using an anti-phosphotyrosine antibody coupled to Sepharose. Proteins (5 μg) were analyzed by 7.5% SDS-PAGE. Tyrosine-phosphorylated PDGF-Rβ (A), PI 3′-K (B), and PLC-γ1 (C) were detected on the same blot by the enhanced chemiluminescence method using the respective monoclonal antibodies. (D) Laser densitometric analysis of the band densities obtained by three separate experiments showing the effect of PDGF-BB on tyrosine phosphorylation of PDGF-Rβ in VSMCs after treatment with various concentrations of EGCG.
Figure 4
Figure 4
Effect of different concentrations of PDGF-BB on tyrosine phosphorylation of PDGF-Rβ, p44mapk/p42mapk, and PI 3′-K. Confluent cells in 75-cm2 flasks were preincubated in serum-free medium for 24 h. Then VSMCs were stimulated with 1–50 ng/ml PDGF-BB for 5 min. Then the cells were lysed, and tyrosine-phosphorylated proteins were immunoprecipitated using an anti-phosphotyrosine antibody coupled to Sepharose. Proteins (5 μg) were analyzed by 7.5% SDS-PAGE. Tyrosine-phosphorylated PDGF-Rβ, p44mapk/p42mapk, and PI 3′-K were detected by the enhanced chemiluminescence method using the respective monoclonal antibodies.
Figure 5
Figure 5
Effect of PDGF-BB on [Ca2+]i in EGCG-treated VSMCs. Confluent VSMCs on slides were precultured for 24 h in serum-free medium in the presence and absence of 50 μM EGCG for 24 h. After loading of the cells with fura-2, PDGF-BB (50 ng/ml) was applied to VSMCs, and changes in fluorescence were monitored. After subtraction of autofluorescence, changes in 340/380 nm excitation wavelength ratio by the emission wavelength of 505 nm were converted into corresponding levels of [Ca2+]i.
Figure 6
Figure 6
Effect of EGCG on the PDGF-Rβ amount in VSMCs. VSMCs were cultured in dishes (diameter: 3 cm) and cultivated until confluence. Then the medium was replaced by serum-free medium, and VSMCs were incubated in the presence and absence of 50 μM EGCG for 24 h. VSMCs were then lysed, and 20 μg of protein were analyzed with SDS-PAGE. PDGF-Rβ was detected by enhanced chemiluminescence Western blotting using anti–PDGF-Rβ antibodies.
Figure 7
Figure 7
Effect of PDGF-BB, FCS, and EGF on cell number. VSMCs in 24-well plates were precultured in serum-free medium in the presence and absence of EGCG for 24 h. Then the medium was replaced with serum-free medium without EGCG, and VSMCs were stimulated with 50 ng/ml PDGF-BB, 5% FCS, and 50 ng/ml EGF. After 24 h cells were trypsinized, and cell counts were determined with the cell counter system CASY-1 (Schärfe System). (A) Effect of different concentrations of EGCG on the PDGF-BB–induced increase of cell number (mean ± SD, n = 3; *p < 0.05 for EGCG-treated vs. untreated [control] VSMCs, **p < 0.05 for EGCG+PDGF-BB versus PDGF-BB effect). (B) Percentage increase of cell number after stimulation of the 50 μM EGCG-treated VSMCs with PDGF-BB, FCS, and EGF (mean ± SD; *p < 0.05 for EGCG+PDGF-BB vs. PDGF-BB, **p < 0.05 for FCS+EGCG vs. FCS effect, ***p < 0.05 for EGF+EGCG vs. EGF effect).
Figure 8
Figure 8
Effect of EGCG on the PDGF-BB–induced DNA synthesis. VSMCs in 24-well plates were precultured in serum-free medium in the presence and absence of different concentrations of EGCG for 24 h. Then the medium was replaced with serum-free medium without EGCG, and VSMCs were stimulated with 50 ng/ml PDGF-BB. After 20 h, 3 μCi/ml of [3H]thymidine were added to the serum-free medium. Four hours later, experiments were terminated. *p < 0.05 for EGCG+PDGF-BB vs. PDGF-BB effect.
Figure 9
Figure 9
Anchorage-independent growth of A172 cells in the presence and absence of EGCG; 5 × 10⁴ single cells in 1.5 ml MEM supplemented with 0.35% agar, 10% FCS, and 20 μM or 50 μM EGCG were plated on a layer of 1 ml of 0.7% agar containing MEM supplemented with 10% FCS and 20 μM or 50 μM EGCG. Representative fields were photographed after 1 h and after 3 wk by phase-contrast light microscope. Bar, 250 μm.
Figure 10
Figure 10
Anchorage-independent growth of sis-transfected NIH 3T3 cells in the presence and absence of EGCG or tyrphostin AG1296. (A) Single cells (5 × 10⁴) in 1.5 ml of MEM supplemented with 0.35% agar, 10% FCS, and 20 μM or 50 μM EGCG or 25 μM tyrphostin AG1296 were plated in 35-mm Petri dishes on a layer of 1 ml of 0.7% agar containing MEM supplemented with 10% FCS, 20 μM, 50 μM EGCG, or 25 μM tyrphostin AG1296. Representative fields were photographed after 1 h hour and 2 wk by phase-contrast light microscope. Bar, 250 μm. (B) Petri dishes (35-mm diameter) containing the visible colonies of sis-NIH 3T3 fibroblasts were scanned with a SnapScan 600 scanner (AGFA, Cologne, Germany) by the inverted modus, and scans were analyzed by the Adobe photoshop software (Adobe Systems, San Jose, CA).

References

    1. Beckman MP, Betzholz C, Heldin C-H, Westermark B, DiMarco E, DiFiore PP, Robbins KC, Aaronson SA. Comparison of biological properties and transforming potential of human PDGF-A and PDGF-B chains. Science. 1988;241:1346–1349. - PubMed
    1. Berridge MJ, Irvine RF. Inositolphosphates and cell signaling. Nature. 1989;341:197–205. - PubMed
    1. Blenis J. Signal transduction via the MAP kinases: proceed at your own RSK. Proc Natl Acad Sci USA. 1993;90:5889–5892. - PMC - PubMed
    1. Bradford M. A rapid and sensitive method for the quantitation of microgram quantities of protein utilizing the principle of protein-dye binding. Anal Biochem. 1976;72:248–254. - PubMed
    1. Chamley JH, Campbell GR, Ross R. The smooth muscle cell in culture. Physiol Rev. 1979;39:1–61. - PubMed

MeSH terms

LinkOut - more resources