. 1999 Apr 13;96(8):4420-5.
doi: 10.1073/pnas.96.8.4420.

Limiting dynamics of high-frequency electromechanical transduction of outer hair cells

Affiliations

Limiting dynamics of high-frequency electromechanical transduction of outer hair cells

G Frank et al. Proc Natl Acad Sci U S A. .

Abstract

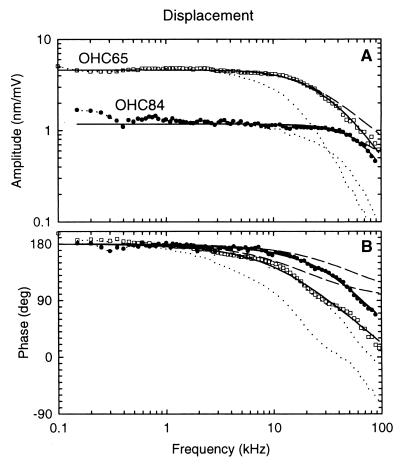
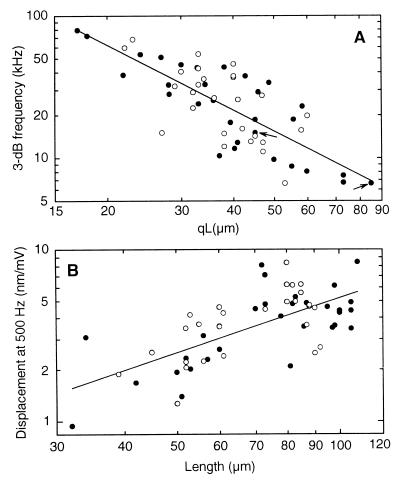
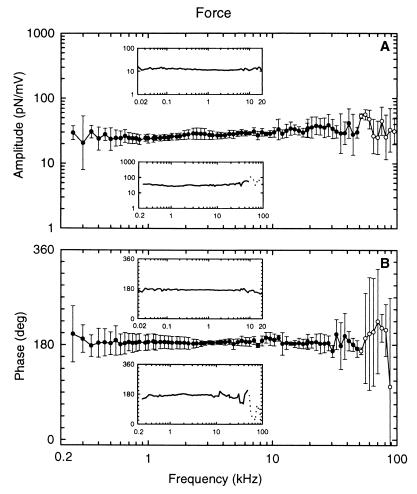
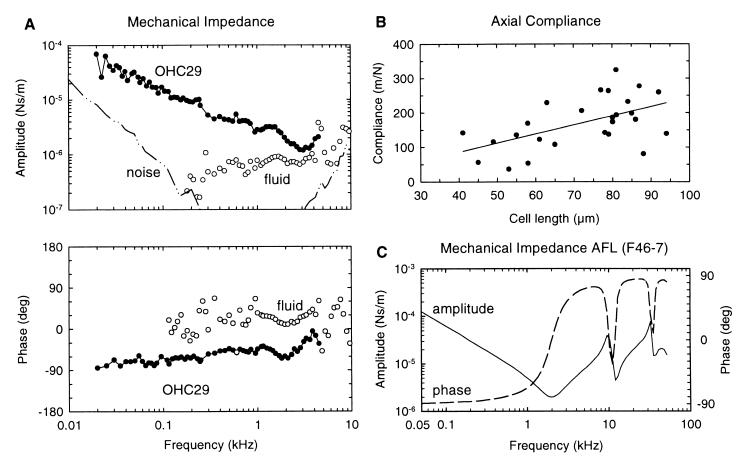
High-frequency resolution is one of the salient features of peripheral sound processing in the mammalian cochlea. The sensitivity originates in the active amplification of the travelling wave on the basilar membrane by the outer hair cells (OHCs), where electrically induced mechanical action of the OHC on a cycle-by-cycle basis is believed to be the crucial component. However, it is still unclear if this electromechanical action is sufficiently fast and can produce enough force to enhance mechanical tuning up to the highest frequencies perceived by mammals. Here we show that isolated OHCs in the microchamber configuration are able to overcome fluid forces with almost constant displacement amplitude and phase up to frequencies well above their place-frequency on the basilar membrane. The high-frequency limit of the electromotility, defined as the frequency at which the amplitude drops by 3 dB from its asymptotic low-frequency value, is inversely dependent on cell length. The frequency limit is at least 79 kHz. For frequencies up to 100 kHz, the electromotile response was specified by an overdamped (Q = 0.42) second-order resonant system. This finding suggests that the limiting factor for frequencies up to 100 kHz is not the speed of the motor but damping and inertia. The isometric force produced by the OHC was constant at least up to 50 kHz, with amplitudes as high as 53 pN/mV being observed. We conclude that the electromechanical transduction process of OHCs possesses the necessary high-frequency properties to enable amplification of the travelling wave over the entire hearing range.


Figures

Figure 1
Figure 1
Experimental configurations for measuring the electromechanical properties of an isolated OHC partially inserted into a micropipette. (A) electrically induced displacement of the cuticular plate of the OHC, the so-called electromotility, XOHCSC. (B) The electromechanical force, FOHC, produced by the OHC under loaded conditions. (C) The mechanical impedance, ZOHC, of the OHC. Circuit diagrams are the electrical equivalents of OHC mechanics, with forces given as voltages and velocities as currents (12). In other words, FOHC and ZOHC are the Thévenin equivalent source force and impedance of the OHC, including extracellular fluid. For the electromotility experiment, the superscript SC is used to denote “short circuit” because, by definition, these measurements were made under unloaded conditions and we are using Thévenin equivalents. A command voltage, USP, applied to the pipette solution induces voltage drops, U1 and U2, across those sections of the cell membrane excluded from and contained in the pipette, respectively (8); U1 and U2 are of opposite phase. Voltage U1 driving the excluded length, qL, is U1 = (1 − q)⋅USP. The electromotility (A) was determined by focusing the beam of a laser Doppler vibrometer (LDV) onto the cuticular plate of the OHC and dividing the measured velocity, VOHCSC, by jω, where j = √−1 and ω is the radial stimulus frequency. FOHC (B) was determined by placing a high-impedance mechanical load, the reverse side of a lever used in atomic force microscopy (AFL), against the cuticular plate. The AFL was a silicon crystal of length 450 μm and thickness 2 μm. The velocity of the AFL, VAFL, in response to electrical induced length changes of the excluded section of the cell was measured with the LDV focused on the AFL. If the mechanical impedance of the AFL, ZAFL, is sufficiently large compared with ZOHC, so that effectively open-circuit conditions prevails, then FOHC can be approximated as ZAFLVAFL. The ZOHC (C) was determined by mechanically vibrating the micropipette with a piezoelectric actuator with velocity VCAP and measuring the resulting velocity of the AFL; the impedance was calculated as ZOHC = ZAFLVAFL/(VCAPVAFL). Moreover, ZOHC can be estimated indirectly from the values of XOHCSC and FOHC determined in the electrical experiments under unloaded (A) and loaded (B) conditions, respectively: ZOHC = FOHC/jωXOHCSC.
Figure 2
Figure 2
Displacement amplitude (A) and phase (B) of electrically induced length changes of two OHCs (□, OHC65; ●, OHC84) of different length measured under unloaded conditions (Fig. 1A). Displacement amplitudes (x[nm]), corrected for cell length and stimulus voltage (x[nm/mV] = x[nm]/[(1 − q)⋅qUSP]) (8), are given in nm/mV. Phase is referred to a depolarizing membrane potential and is positive for contraction; that is, for displacement away from the LDV. The data (symbols) are shown corrected for the measured electrical low-pass filter characteristic of the microchamber, with the OHC attached (dotted lines). Displacement data were fitted by the amplitude and phase responses of a second-order resonant system (full lines), representing the mechanical properties of the cell and extracellular fluid. Amplitude and phase were fitted simultaneously by using a software package in Microsoft Excel 7.0. The shape of the responses is described by only two free parameters: the resonant frequency, fOHC, and the quality factor, Q. Since Q was always less than 1/√2, the high-frequency limit was defined as the frequency, f3dB, at which the amplitude drops by 3 dB from its asymptotic low-frequency value; it was calculated from fOHC and Q by using the formula (f3dB/fOHC)2 = 1 − 0.5Q−2 + ((1 − 0.5Q−2)2 + 1)1/2. For some cases, a time delay (τ) was included as a free parameter in the fit function for the phase response. However, the estimated delay was in the range of the precision of our measurement equipment (<1 μs). For OHC65 (length = 83 μm; qL = 55.6 μm): fOHC = 38 kHz and Q = 0.41, giving f3dB = 18.6 kHz; τ = 0.7 μs. For OHC84 (length = 51 μm; qL = 24 μm): fOHC = 66 kHz and Q = 0.59, giving f3dB = 53.4 kHz; τ = 0.1 μs. For OHC65 and OHC84, the electrical corner frequencies of the microchamber loaded by the cell were 9.5 kHz and 23.3 kHz, respectively. The dashed lines are fits for another type of mechanical system: a first-order low-pass filter containing only stiffness and damping (corner frequency: 20 kHz for OHC65 and 54 kHz for OHC84). The near-perfect fit for a second-order resonant system and the poor fit for a first-order, low-pass filter demonstrate that the high-frequency response is determined not by damping alone, but also by inertia.
Figure 3
Figure 3
Dependence of the 3-dB frequency of electromotility on the excluded length of the cell (qL) (A) and the asymptotic low-frequency amplitude as a function of cell length (B). f3dB decreases hyperbolically with qL, with exponent of −1.5, beginning at a frequency of 79 kHz for qL = 17 μm. [Regression line: log f3dB = −(1.51 ± 0.17)log(qL) + (3.76 ± 0.3); r = −0.76, n = 57; with f3dB in kHz, qL in μm.] The two arrows indicate measurements from the same cell for different qL. The low-frequency (500-Hz) displacement amplitude is directly proportional to cell length, with proportionality constant of 4⋅10−5/mV, with L in meters and amplitude in m/mV. [Regression line: log y = (1.06 ± 0.16)log L − (1.4 ± 0.3); r = 0.67; n = 57; with y in nm/mV and L in μm.] Notice, 1.06 ± 0.16 is not significantly different from unity (P < 0.05), implying direct proportionality. Solid circles represent OHC data where the electrical corner frequency (fMC) was determined from measurements of the electrical input impedance of the micropipette with and without cell (n = 30). Open circles represent data where the electrical input impedance was not measured (n = 27); in these cases, fMC was derived by fitting the electromotile response with the mechanical filter together with a first-order low-pass filter representing the electrical properties of the microchamber configuration. Because there was no statistical difference between the two populations (P < 0.05), regression lines are for the collated data.
Figure 4
Figure 4
Amplitude (A) and phase (B) of the electromechanical force generated by the OHC as a function of stimulus frequency, measured under loaded conditions (Fig. 1B). Data for three OHCs (qL = 68, 38, 28 μm), stimulated with frequencies between 250 Hz and 100 kHz, were averaged. (Lower Inset) Data for one of the averaged cells. The standard deviation of the measurement values is given by the vertical error bars. (Upper Inset) Representative example of an OHC where the electromechanical force was measured between 20 Hz and 20 kHz (qL = 15 μm). Amplitudes and phases are independent of frequency up to at least 50 kHz. Unavoidable resonances in the mechanical support for the AFL are responsible for the peaks and dips in the responses above 50 kHz (open circles), as well as the phase lag of 20° between 13 kHz and 32 kHz. The compliance of the AFL was 6 m/N.
Figure 5
Figure 5
(A) Amplitude and phase of the mechanical impedance of the OHC, ZOHC, as a function of stimulus frequency. Up to about 3 kHz, ZOHC resembles that of a compliance with slope near −6 dB/octave (−4.8 dB/octave) and an initial phase near −90°. For higher stimulus frequencies, the impedance associated with fluid coupling (open circles) between the micropipette and the AFL constitutes an appreciable part of the measured impedance, thus preventing estimation of ZOHC above about 5 kHz. (B) Axial compliance of the OHC, COHC, as a function of cell length. COHC increases with cell length (r = 0.54, n = 26): C [m/N] = (2.37 ± 0.17)⋅106 L [m]. For the regression analysis, the axis intercept could be held constant at zero because when made variable it was found to be not significantly different from zero; C = (2.64 ± 0.83)⋅L − (20 ± 61). (C) Amplitude and phase of the impedance of the AFL (F46–7) used for the measurements of cell OHC29 (see Material and Methods for calibration details). The compliance of the AFL was 29 m/N.

Similar articles

Cited by

References

    1. Brownell W E, Bader C R, Bertrand D, de Ribaupierre Y. Science. 1985;227:194–196. - PubMed
    1. Zwicker E. Biol Cybern. 1979;35:243–250. - PubMed
    1. Hudspeth A J. Curr Opin Neurobiol. 1997;7:480–486. - PubMed
    1. Kössl M. Naturwissenschaften. 1992;79:425–427. - PubMed
    1. Santos-Sacchi J, Dilger J P. Hear Res. 1988;35:143–150. - PubMed

Publication types

LinkOut - more resources