

Expression pattern and, surprisingly, gene length shape codon usage in Caenorhabditis, Drosophila, and Arabidopsis
- PMID: 10200288
- PMCID: PMC16358
- DOI: 10.1073/pnas.96.8.4482
Expression pattern and, surprisingly, gene length shape codon usage in Caenorhabditis, Drosophila, and Arabidopsis
Abstract
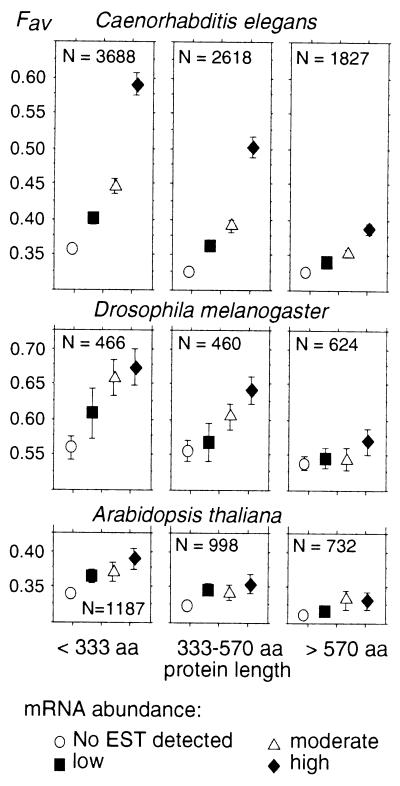
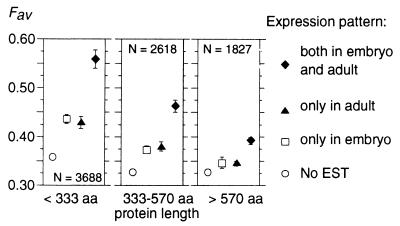
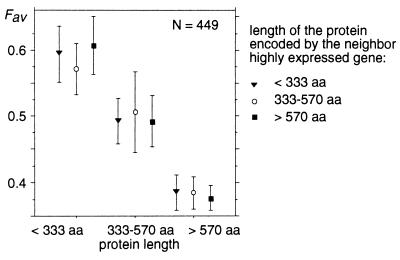
We measured the expression pattern and analyzed codon usage in 8,133, 1,550, and 2,917 genes, respectively, from Caenorhabditis elegans, Drosophila melanogaster, and Arabidopsis thaliana. In those three species, we observed a clear correlation between codon usage and gene expression levels and showed that this correlation is not due to a mutational bias. This provides direct evidence for selection on silent sites in those three distantly related multicellular eukaryotes. Surprisingly, there is a strong negative correlation between codon usage and protein length. This effect is not due to a smaller size of highly expressed proteins. Thus, for a same-expression pattern, the selective pressure on codon usage appears to be lower in genes encoding long rather than short proteins. This puzzling observation is not predicted by any of the current models of selection on codon usage and thus raises the question of how translation efficiency affects fitness in multicellular organisms.
Figures
References
Publication types
MeSH terms
Substances
LinkOut - more resources
Full Text Sources
Other Literature Sources
Molecular Biology Databases
