

Polymorphism in RANTES chemokine promoter affects HIV-1 disease progression
- PMID: 10200305
- PMCID: PMC16375
- DOI: 10.1073/pnas.96.8.4581
Polymorphism in RANTES chemokine promoter affects HIV-1 disease progression
Abstract
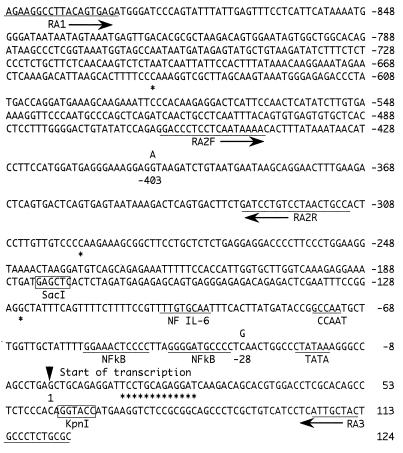
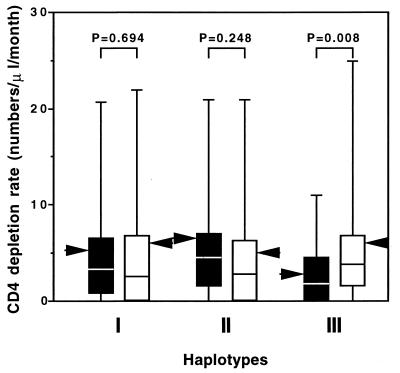
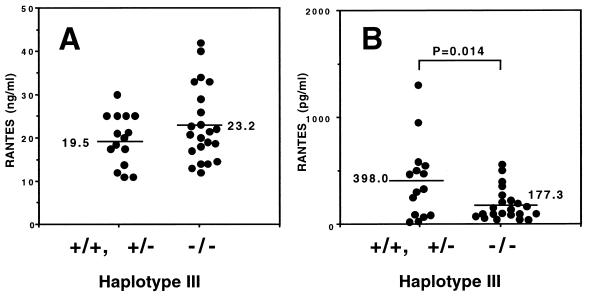
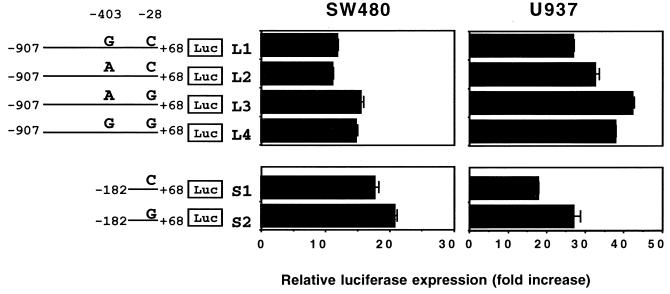
RANTES (regulated on activation normal T cell expressed and secreted) is one of the natural ligands for the chemokine receptor CCR5 and potently suppresses in vitro replication of the R5 strains of HIV-1, which use CCR5 as a coreceptor. Previous studies showed that peripheral blood mononuclear cells or CD4(+) lymphocytes obtained from different individuals had wide variations in their ability to secrete RANTES. These findings prompted us to analyze the upstream noncoding region of the RANTES gene, which contains cis-acting elements involved in RANTES promoter activity, in 272 HIV-1-infected and 193 non-HIV-1-infected individuals in Japan. Our results showed that there were two polymorphic positions, one of which was associated with reduced CD4(+) lymphocyte depletion rates during untreated periods in HIV-1-infected individuals. This mutation, RANTES-28G, occurred at an allele frequency of approximately 17% in the non-HIV-1-infected Japanese population and exerted no influence on the incidence of HIV-1 infection. Functional analyses of RANTES promoter activity indicated that the RANTES-28G mutation increases transcription of the RANTES gene. Taken together, these data suggest that the RANTES-28G mutation increases RANTES expression in HIV-1-infected individuals and thus delays the progression of the HIV-1 disease.
Figures
References
-
- Berger E A, Doms R W, Fenyo E-M, Korber B T M, Littman D R, Moore J P, Sattentau Q J, Schuitemaker H, Sodroski J, Weiss R A. Nature (London) 1998;391:240. - PubMed
-
- Alkhatib G, Combadiere C, Broder C C, Feng Y, Kennedy P E, Murphy P M, Berger E A. Science. 1996;272:1955–1958. - PubMed
-
- Choe H, Farzan M, Sun Y, Sullivan N, Rollins B, Ponath P D, Wu L, Mackay C R, LaRosa G, Newman W, et al. Cell. 1996;85:1135–1148. - PubMed
-
- Deng H, Liu R, Ellmerier W, Choe S, Unutmaz D, Burkhart M, Di Marzio P, Marmon S, Sutton R E, Hill C M, et al. Nature (London) 1996;381:661–666. - PubMed
-
- Doranz B J, Rucker J, Yi Y, Smyth R J, Samson M, Peiper S C, Parmentier M, Collman R G, Doms R W. Cell. 1996;85:1149–1158. - PubMed
Publication types
MeSH terms
Substances
Associated data
- Actions
- Actions
- Actions
LinkOut - more resources
Full Text Sources
Other Literature Sources
Medical
Molecular Biology Databases
Research Materials
