. 1999 Apr 13;96(8):4586-91.
doi: 10.1073/pnas.96.8.4586.

Noninvasive measurement of anatomic structure and intraluminal oxygenation in the gastrointestinal tract of living mice with spatial and spectral EPR imaging

Affiliations

Noninvasive measurement of anatomic structure and intraluminal oxygenation in the gastrointestinal tract of living mice with spatial and spectral EPR imaging

G He et al. Proc Natl Acad Sci U S A. .

Abstract

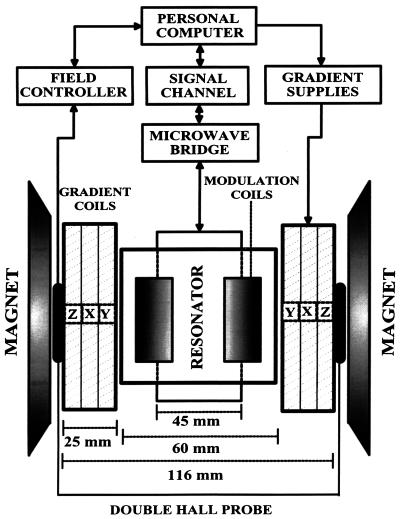
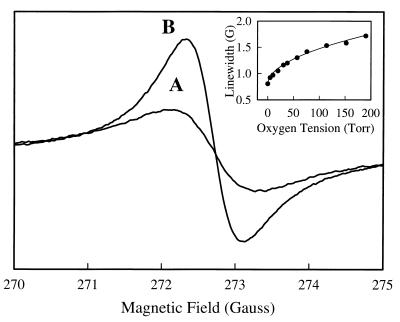
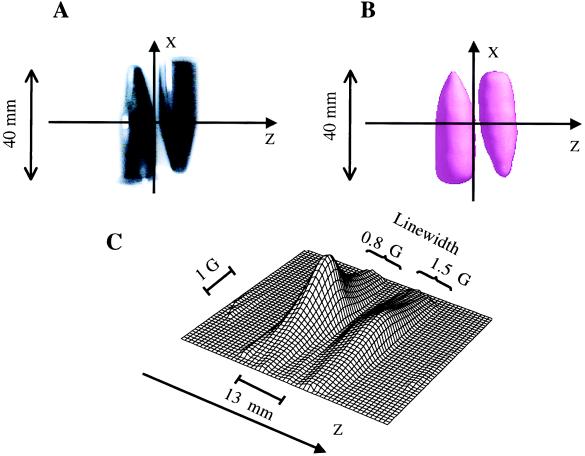
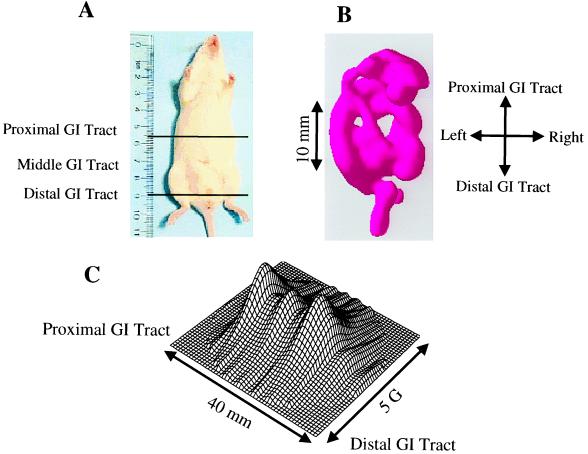
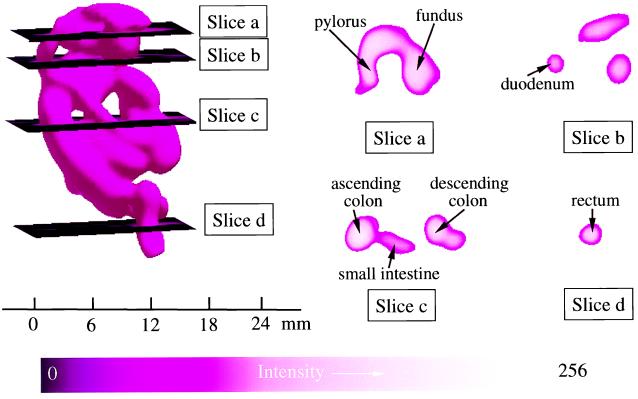
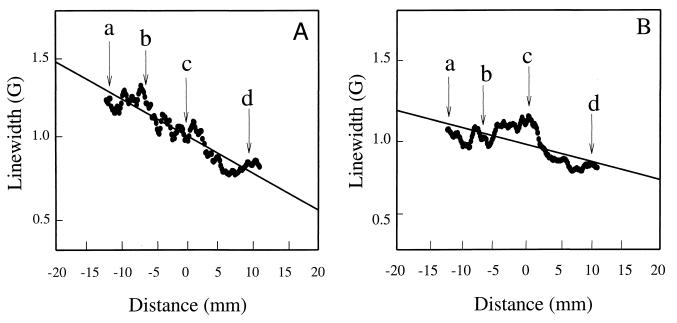
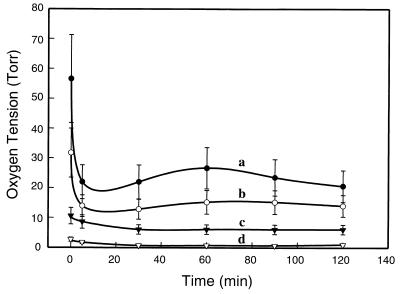
EPR imaging has emerged as an important tool for noninvasive three-dimensional (3D) spatial mapping of free radicals in biological tissues. Spectral-spatial EPR imaging enables mapping of the spectral information at each spatial position, and, from the observed line width, the localized tissue oxygenation can be mapped. We report the development of EPR imaging instrumentation enabling 3D spatial and spectral-spatial EPR imaging of small animals. This instrumentation, along with the use of a biocompatible charcoal oximetry-probe suspension, enabled 3D spatial imaging of the gastrointestinal (GI) tract, along with mapping of oxygenation in living mice. By using these techniques, the oxygen tension was mapped at different levels of the GI tract from the stomach to the rectum. The results clearly show the presence of a marked oxygen gradient from the proximal to the distal GI tract, which decreases after respiratory arrest. This technique for in vivo mapping of oxygenation is a promising method, enabling the noninvasive imaging of oxygen within the normal GI tract. This method should be useful in determining the alterations in oxygenation associated with disease.


Figures

Figure 1
Figure 1
Diagram of the 750-MHz whole-body EPR imaging system.
Figure 2
Figure 2
Block diagram of the narrow-band rf bridge. For the narrow-band bridge, a wider sweep is required to visualize the resonator mode; therefore, the bridge has two oscillators. The main low-noise narrow-band (730- to 780-MHz) oscillator (Magnum Microwave, San Jose, CA) works in the “operate” mode, providing low-noise bridge performance, whereas a Voltage Controlled Oscillator (VCO; Minicircuits, Brooklyn, NY) with a wide tuning range replaces the main oscillator in the “tune” mode, allowing visualization of the resonator mode.
Figure 3
Figure 3
EPR spectra of charcoal suspension equilibrated with room air (21% oxygen; line A) and 0% oxygen (line B). The Inset shows the variation of line width that occurs as a function of oxygen tension. Measurements were performed with a microwave frequency of 763 MHz, a modulation amplitude of 0.4 G, a field modulation of 100-kHz, and a microwave power of 60 mW.
Figure 4
Figure 4
EPR imaging of a phantom of the charcoal spin probe. The phantom consists of two conical centrifuge tubes. (A) Photograph of the phantom; (B) 3D spatial image; (C) 2D spectral–spatial image. The imaging parameters for 3D spatial imaging were a 746-MHz microwave frequency; 1,024 projections; a 15-G/cm gradient; a 5-s projection acquisition time; a 0.4-G modulation amplitude; and a 40-mm spatial window (field of view). The parameters for 2D spectral–spatial image were a 5-G spectral window; a 40-mm spatial window; a 5-s base projection acquisition time; and a 5-min total acquisition time. Microwave power of 60 mW was used.
Figure 5
Figure 5
Photograph of the mouse studied with demarcation of the region imaged and corresponding 3D spatial and 2D spectral–spatial image data. (A) A photograph of the mouse with a ruler for scale. The area imaged is shown between black lines. The mouse was fed with the charcoal probe for 1 day. (B) Spatial EPR 3D image visualizing the location of the charcoal probe in the GI tract. (C) Spectral–spatial 2D image data along the longitudinal axis from the proximal to the distal GI tract. The parameters for 3D spatial and for 2D spectral–spatial imaging are described in Fig. 4.
Figure 6
Figure 6
Spatial EPR 3D image data showing the cross-sectional structure of the GI tract at different levels. (Left) The complete 3D surface rendering of the image of the charcoal probe in the GI tract. Planar sections through this image are shown at four levels. Slice a shows a section at the level of the mid stomach where the fundus and pylorus of the stomach can be seen with the taper to the pyloric valve. Slice b shows a section at the level of the mid duodenum. The lumen of the duodenum is seen on the left along with less defined cuts on the right through the lower edge of the lumen of the stomach, anteriorly, and what appear to be the transverse colon and small intestine just below the stomach, posteriorly. Slice c shows a section at the level of the mid colon and mid small intestine where distinct cuts through the ascending colon, small intestine, and descending colon occur. Slice d shows a section at the level of the distal sigmoid colon–rectal junction where the lumen is seen clearly. The parameters for 3D spatial imaging are described in Fig. 4.
Figure 7
Figure 7
Graph of the line width of the charcoal oximetry probe at different locations of the GI tract of the mouse when it was alive (A) and 30 min after respiratory arrest (B). The arrows show the position of each of the planar cross sections shown in Fig. 6: a, level of mid stomach; b, level of mid duodenum; c, level of mid colon and mid small intestine; and d, level of sigmoid colon–rectal junction.
Figure 8
Figure 8
Time course of the change in oxygen tension at different levels of the GI tract before and after respiratory arrest. Values were calculated from the oxygen-dependent line width broadening by using the calibration data shown in Fig. 3. The levels are as defined by the planar cross sections shown in Fig. 6. Line a, level of mid stomach; line b, level of mid duodenum; line c, level of mid colon and mid small intestine; and line d, level of sigmoid colon–rectal junction.

Similar articles

Cited by

References

    1. Sheridan W G, Lowndes R H, Young H L. Am J Surg. 1990;159:314–319. - PubMed
    1. Knudson M M, Bermudez K M, Doyle C A, Mackersie R C, Hopf H P, Morabito D. J Trauma. 1997;42:608–616. - PubMed
    1. Hauser C J, Locke R R, Kao H W, Patterson J, Zipser R D. J Lab Clin Med. 1988;112:68–71. - PubMed
    1. Cooper G J, Sherry K M, Thorpe J A. Eur J Cardiothorac Surg. 1995;9:158–160. - PubMed
    1. Larsen P N, Moesgaard F, Naver L, Rosenberg J, Gottrup F, Kirkegaard P, Helledie N. Scand J Gastroenterol. 1991;26:409–418. - PubMed

MeSH terms

LinkOut - more resources