. 1999 Apr 13;96(8):4674-9.
doi: 10.1073/pnas.96.8.4674.

Seasonal neuroplasticity in the songbird telencephalon: a role for melatonin

Affiliations

Seasonal neuroplasticity in the songbird telencephalon: a role for melatonin

G E Bentley et al. Proc Natl Acad Sci U S A. .

Abstract

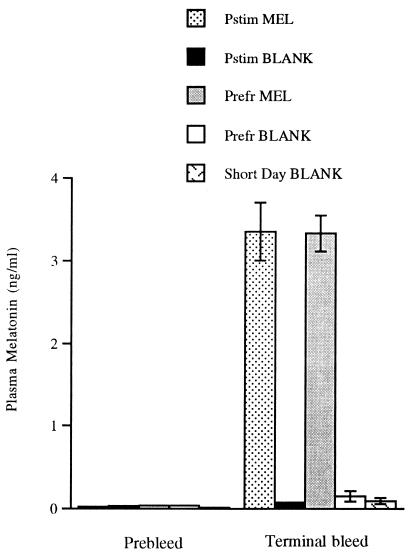
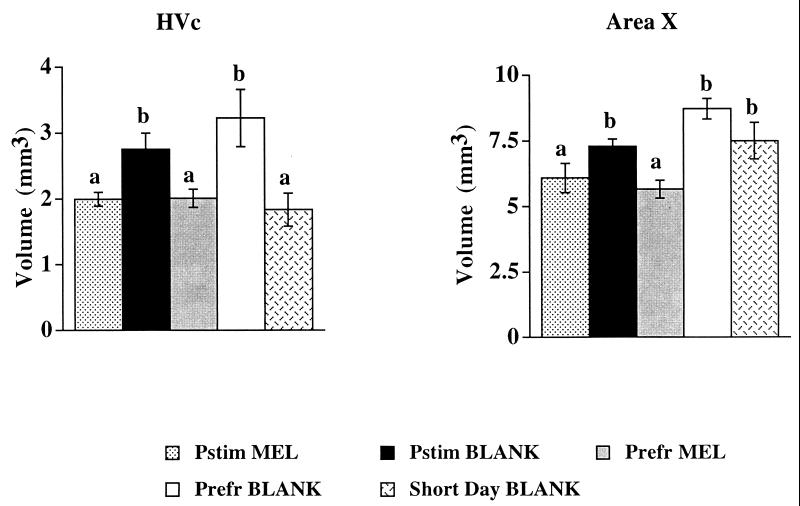
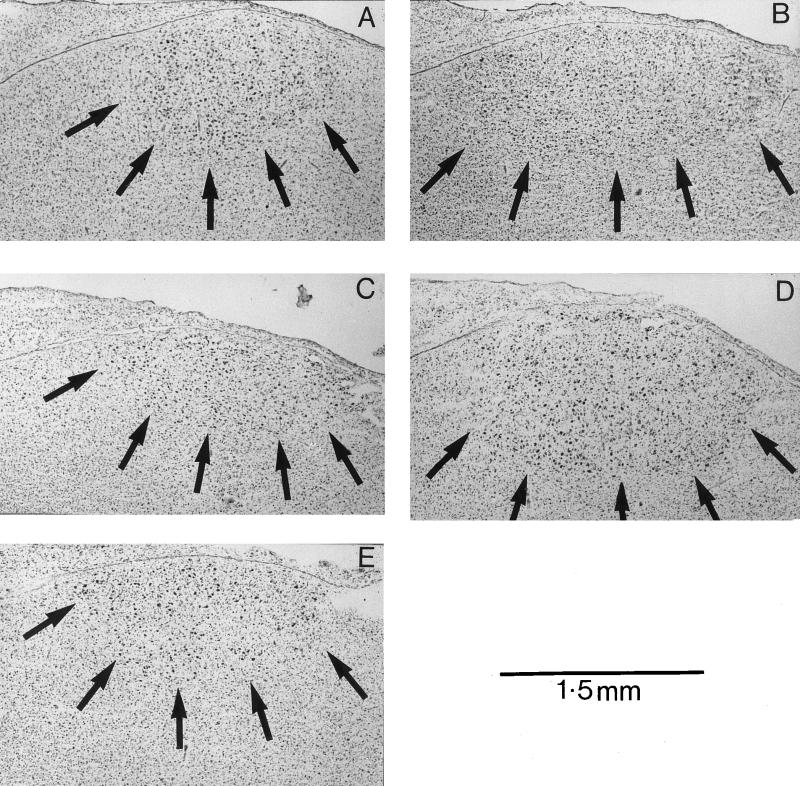
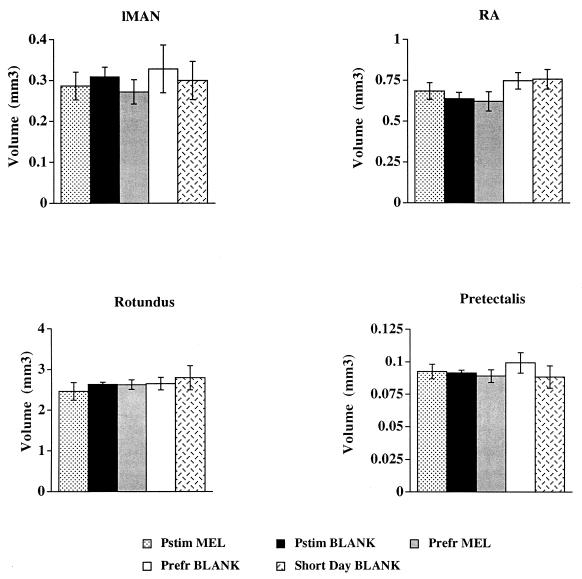
Neuroplasticity in the vocal control system of songbirds is strongly influenced by seasonal fluctuations in circulating testosterone. These seasonally plastic telencephalic structures are implicated in the learning and production of song in songbirds. The role of the indoleamine melatonin in seasonal adaptations in birds has remained unclear. In this experiment, European starlings were castrated to remove the neuromodulating activity of gonadal steroids and were exposed to different photoperiods to induce reproductive states characteristic of different seasonal conditions. Long days increased the volume of the song-control nucleus high vocal center compared with its volume on short days. Exogenous melatonin attenuated the long-day-induced volumetric increase in high vocal center and also decreased the volume of another song-control nucleus, area X. This effect was observed regardless of reproductive state. To our knowledge, this is the first direct evidence of a role for melatonin in functional plasticity within the central nervous system of vertebrates.


Figures

Figure 1
Figure 1
Plasma melatonin before and during the experiment. Plasma melatonin concentrations in all groups of starlings were at or very close to the detection limit of the assay (0.01 ng/ml) before implantation. The graph demonstrates the rise in plasma melatonin over baseline concentrations in those groups implanted with melatonin (Pstim MEL and Prefr MEL).
Figure 2
Figure 2
Reconstructed volumes of song-control nuclei after treatment. Data were analyzed by using one-way ANOVA followed by Fisher’s protected least significant difference for multiple comparisons. ANOVA for area X: F = 7.695 (4, 21), P < 0.0007. ANOVA for HVc: F = 5.157 (4, 21), P < 0.006. The letters a or b above a particular column indicate statistically significant difference for that group in comparison to another group within a particular graph. They correspond to the following probability values (for HVc): Pstim MEL vs. Pstim BLANK, P = 0.0347; Pstim MEL vs. Prefr MEL, P = 0.9985; Pstim MEL vs. Prefr BLANK, P = 0.0088; Pstim MEL vs. Short Day Blank, P = 0.5038; Pstim BLANK vs. Prefr MEL P = 0.0353; Pstim BLANK vs. Prefr BLANK, P = 0.3671; Pstim BLANK vs. Short Day BLANK, P = 0.0123; Prefr MEL vs. Prefr BLANK, P = 0.0044; Prefr MEL vs. Short Day BLANK, P = 0.4634; Prefr BLANK vs. Short Day BLANK, P = 0.0018. For area X: Pstim MEL vs. Pstim BLANK, P = 0.0394; Pstim MEL vs. Prefr MEL, P = 0.4753; Pstim MEL vs. Prefr BLANK, P = 0.0006; Pstim MEL vs. Short Day Blank, P = 0.0406; Pstim BLANK vs. Prefr MEL P = 0.0059; Pstim BLANK vs. Prefr BLANK, P = 0.0572; Pstim BLANK vs. Short Day BLANK, P = 0.8378; Prefr MEL vs. Prefr BLANK, P < 0.0001; Prefr MEL vs. Short Day BLANK, P = 0.0077; Prefr BLANK vs. Short Day BLANK, P = 0.1209.
Figure 3
Figure 3
Typical examples of Nissl-stained sections containing the HVc. (A) Pstim MEL; (B) Pstim BLANK; (C) Prefr MEL; (D) Prefr BLANK; (E) Short Day BLANK. Note the relatively small areas of HVc in the melatonin-treated and short-day birds.
Figure 4
Figure 4
Reconstructed volumes of song-control nuclei and comparison control nuclei after treatment. Data were analyzed by using one-way ANOVA followed by Fisher’s protected least significant difference for multiple comparisons. No statistically significant differences were observed in lMAN, RA, nucleus rotundus, or nucleus pretectalis.

References

    1. Burger J W. J Exp Zool. 1939;80:249–257.
    1. Nicholls T J, Goldsmith A R, Dawson A. Physiol Rev. 1988;68:133–176. - PubMed
    1. Sohrabji F, Nordeen E J, Nordeen K W. Behav Neural Biol. 1990;53:51–63. - PubMed
    1. Scharff C, Nottebohm F. J Neurosci. 1991;11:2896–2913. - PMC - PubMed
    1. Nottebohm F. Science. 1981;214:1368–1370. - PubMed

Publication types

LinkOut - more resources