

Psychophysical isolation of a motion-processing deficit in schizophrenics and their relatives and its association with impaired smooth pursuit
- PMID: 10200329
- PMCID: PMC16399
- DOI: 10.1073/pnas.96.8.4724
Psychophysical isolation of a motion-processing deficit in schizophrenics and their relatives and its association with impaired smooth pursuit
Abstract
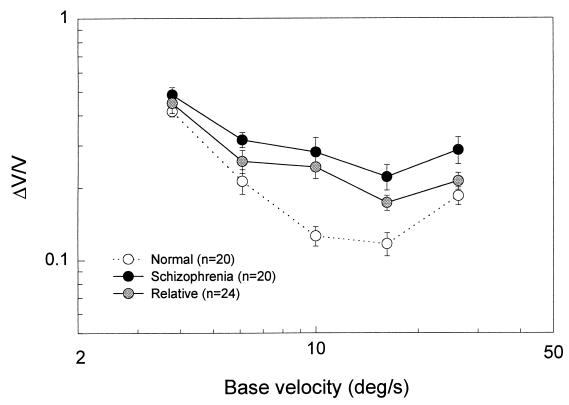
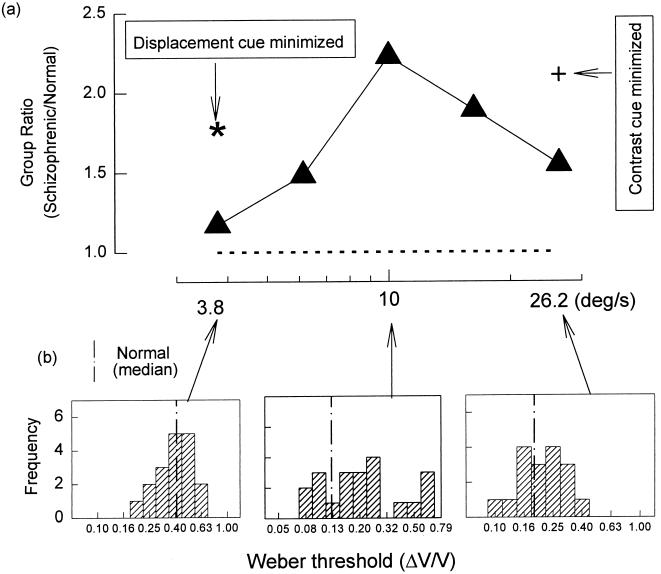
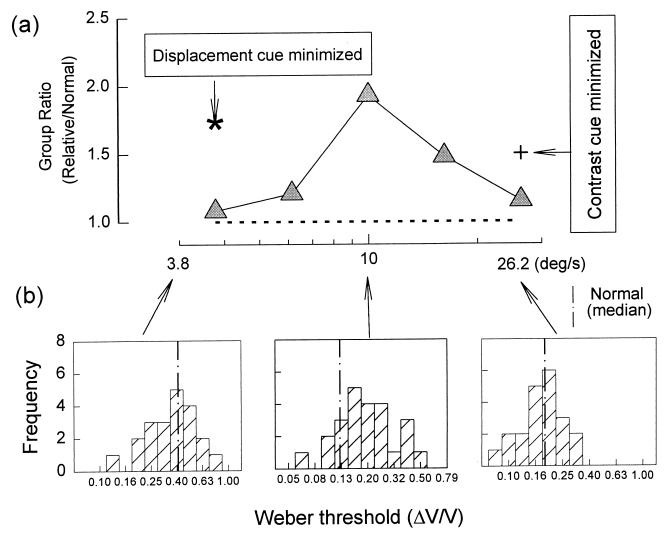
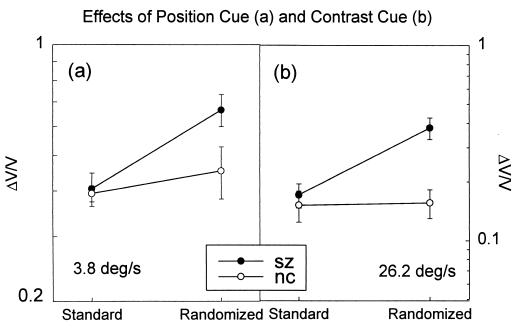
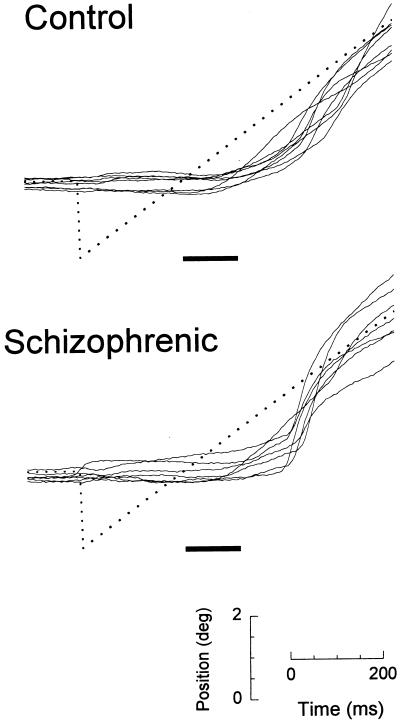
Schizophrenia patients and many of their relatives show impaired smooth pursuit eye tracking. The brain mechanisms underlying this impairment are not yet known, but because reduced open-loop acceleration and closed-loop gain accompany it, compromised perceptual processing of motion signals is implicated. A previous study showed that motion discrimination is impaired in schizophrenia patients. Motion discrimination can make use of position and contrast as well as velocity cues. Here, we report that the motion discrimination deficit, which occurs in both schizophrenic patients and in their first-degree relatives, involves a failure of velocity detection, which appears when judging intermediate target velocities. At slower and faster velocities, judgments of velocity discrimination seemed normal until we experimentally disentangled velocity cues from nonmotion cues. We further report that compromised velocity discrimination is associated with sluggish initiation of smooth pursuit. These findings point to specific central nervous system correlates of schizophrenic pathophysiology.
Figures
Similar articles
-
Dependence of impaired eye tracking on deficient velocity discrimination in schizophrenia.Arch Gen Psychiatry. 1999 Feb;56(2):155-61. doi: 10.1001/archpsyc.56.2.155. Arch Gen Psychiatry. 1999. PMID: 10025440
-
Smooth pursuit eye movements to extraretinal motion signals: deficits in relatives of patients with schizophrenia.Arch Gen Psychiatry. 1998 Sep;55(9):830-6. doi: 10.1001/archpsyc.55.9.830. Arch Gen Psychiatry. 1998. PMID: 9736010
-
A model of smooth pursuit eye movement deficit associated with the schizophrenia phenotype.Psychophysiology. 2003 Mar;40(2):277-84. doi: 10.1111/1469-8986.00029. Psychophysiology. 2003. PMID: 12820868 Free PMC article. Clinical Trial.
-
Eye tracking dysfunction in schizophrenia: characterization and pathophysiology.Curr Top Behav Neurosci. 2010;4:311-47. doi: 10.1007/7854_2010_60. Curr Top Behav Neurosci. 2010. PMID: 21312405 Free PMC article. Review.
-
And yet it moves: perceptual illusions and neural mechanisms of pursuit compensation during smooth pursuit eye movements.Neurosci Biobehav Rev. 2012 Jan;36(1):143-51. doi: 10.1016/j.neubiorev.2011.05.005. Epub 2011 May 17. Neurosci Biobehav Rev. 2012. PMID: 21616092 Review.
Cited by
-
Eye movement deficits in schizophrenia: investigation of a genetically homogenous Icelandic sample.Eur Arch Psychiatry Clin Neurosci. 2008 Sep;258(6):373-83. doi: 10.1007/s00406-008-0806-y. Epub 2008 Apr 24. Eur Arch Psychiatry Clin Neurosci. 2008. PMID: 18437278 Clinical Trial.
-
Abnormal visual motion processing in schizophrenia: a review of research progress.Schizophr Bull. 2011 Jul;37(4):709-15. doi: 10.1093/schbul/sbr020. Epub 2011 Mar 24. Schizophr Bull. 2011. PMID: 21436317 Free PMC article. Review.
-
Reduced Visual Function in Schizotypal Traits: An Exploratory Study.Schizophr Bull. 2025 Mar 4;51(Suppl 2):S205-S213. doi: 10.1093/schbul/sbae049. Schizophr Bull. 2025. PMID: 40037828 Free PMC article.
-
Subcortical visual dysfunction in schizophrenia drives secondary cortical impairments.Brain. 2007 Feb;130(Pt 2):417-30. doi: 10.1093/brain/awl233. Epub 2006 Sep 19. Brain. 2007. PMID: 16984902 Free PMC article.
-
Eye movements of patients with schizophrenia in a natural environment.Eur Arch Psychiatry Clin Neurosci. 2016 Feb;266(1):43-54. doi: 10.1007/s00406-014-0567-8. Epub 2014 Dec 4. Eur Arch Psychiatry Clin Neurosci. 2016. PMID: 25472882 Free PMC article.
References
-
- Gottesman I I, Shields J. Schizophrenia and Genetics: A Twin Study Vantage Point. New York: Academic; 1972.
-
- Kety S S, Rosenthal D, Wender P H. In: Critical Issues in Psychiatric Diagnosis. Spitzer R L, Klein D F, editors. New York: Raven; 1978. pp. 213–223.
-
- Tsuang M T, Winokur G, Crowe R R. Brit J Psychiatry. 1980;137:497–504. - PubMed
-
- Holzman P S. J Psychiatr Res. 1992;26:427–445. - PubMed
-
- Holzman P S, Proctor L R, Hughes D W. Science. 1973;181:179–181. - PubMed
Publication types
MeSH terms
Grants and funding
LinkOut - more resources
Full Text Sources
Other Literature Sources
Medical
