

Absence of modulation of the expressed calcium channel alpha1G subunit by alpha2delta subunits
- PMID: 10200414
- PMCID: PMC2269284
- DOI: 10.1111/j.1469-7793.1999.0639u.x
Absence of modulation of the expressed calcium channel alpha1G subunit by alpha2delta subunits
Abstract
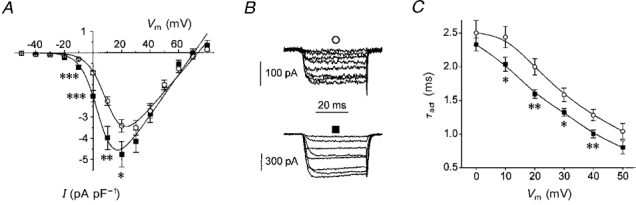
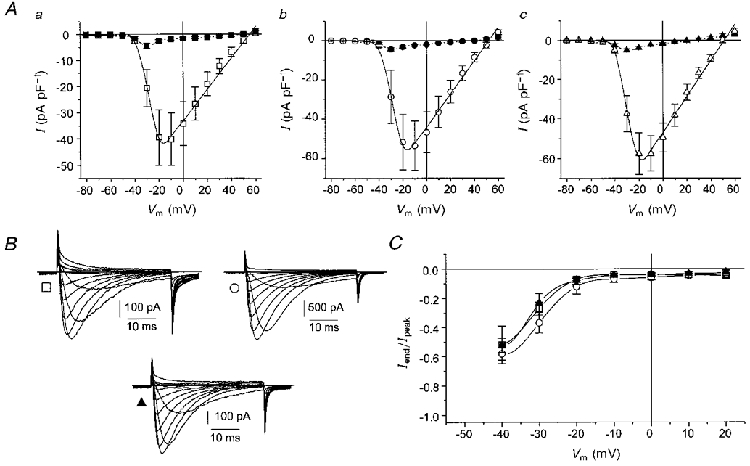
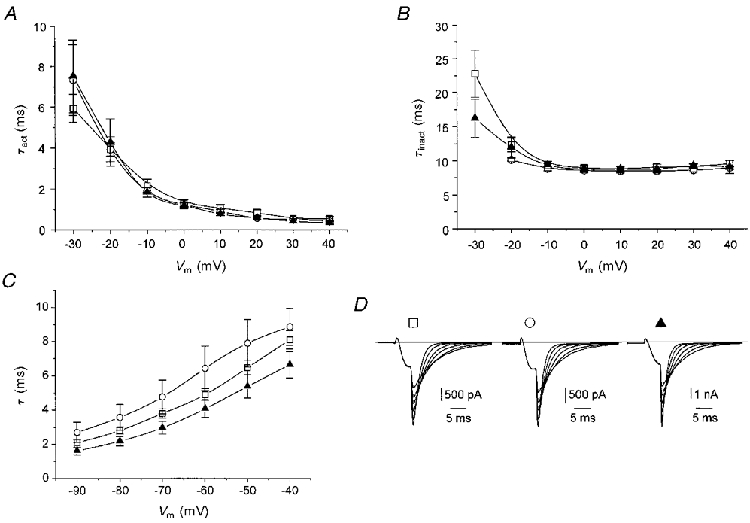
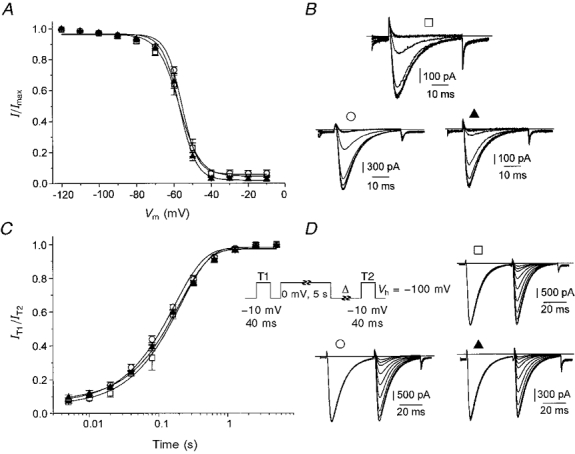
1. The modulatory action of the alpha2delta subunit on various high-voltage-activated calcium channels has been demonstrated previously. However, very little is known about auxiliary subunit modulation of low-voltage-activated (LVA) calcium channels. We have examined the modulation of the alpha1G subunit corresponding to the neuronal T-type calcium channel by the ubiquitously expressed alpha2delta-1 and brain-specific alpha2delta-3 subunits. 2. The alpha1G subunit was expressed alone or in combination with either the alpha2delta-1 or alpha2delta-3 subunit in human embryonic kidney (HEK 293) cells and whole-cell barium currents were measured. The current density-voltage relationships for peak and sustained current, kinetics of current activation and inactivation, voltage dependence of current inactivation and time course of the recovery from inactivation were analysed for each type of expressed channel. No significant difference was found for any of the examined parameters. 3. These results suggest that the LVA alpha1G channel is not regulated by known auxiliary alpha2delta subunits.
Figures
Similar articles
-
Voltage-dependent calcium channels.Gen Physiol Biophys. 2005 Jun;24 Suppl 1:1-78. Gen Physiol Biophys. 2005. PMID: 16096350 Review.
-
Neuronal distribution and functional characterization of the calcium channel alpha2delta-2 subunit.Eur J Neurosci. 2000 Apr;12(4):1217-26. doi: 10.1046/j.1460-9568.2000.01009.x. Eur J Neurosci. 2000. PMID: 10762351
-
Mechanism of auxiliary subunit modulation of neuronal alpha1E calcium channels.J Gen Physiol. 1998 Aug;112(2):125-43. doi: 10.1085/jgp.112.2.125. J Gen Physiol. 1998. PMID: 9689023 Free PMC article.
-
A T-type calcium channel from mouse brain.Pflugers Arch. 1999 Apr;437(5):710-5. doi: 10.1007/s004240050836. Pflugers Arch. 1999. PMID: 10087148
-
Low voltage activated calcium channels: from genes to function.Gen Physiol Biophys. 2000 Jun;19(2):121-36. Gen Physiol Biophys. 2000. PMID: 11156438 Review.
Cited by
-
Voltage-gated calcium channels and their auxiliary subunits: physiology and pathophysiology and pharmacology.J Physiol. 2016 Oct 1;594(19):5369-90. doi: 10.1113/JP272262. Epub 2016 Jul 5. J Physiol. 2016. PMID: 27273705 Free PMC article. Review.
-
Calcium channels: unanswered questions.J Bioenerg Biomembr. 2003 Dec;35(6):461-75. doi: 10.1023/b:jobb.0000008020.86004.28. J Bioenerg Biomembr. 2003. PMID: 15000516 Review.
-
Low-voltage-activated ("T-Type") calcium channels in review.J Bioenerg Biomembr. 2003 Dec;35(6):533-75. doi: 10.1023/b:jobb.0000008024.77488.48. J Bioenerg Biomembr. 2003. PMID: 15000520 Review.
-
Molecular regions underlying the activation of low- and high-voltage activating calcium channels.Eur Biophys J. 2005 Nov;34(8):1017-29. doi: 10.1007/s00249-005-0487-7. Epub 2005 May 28. Eur Biophys J. 2005. PMID: 15924245
-
Pharmacological Inhibition of Voltage-gated Ca(2+) Channels for Chronic Pain Relief.Curr Neuropharmacol. 2013 Dec;11(6):606-20. doi: 10.2174/1570159X11311060005. Curr Neuropharmacol. 2013. PMID: 24396337 Free PMC article.
References
-
- Bangalore R, Mehrke G, Gingrich K, Hofmann F, Kass RS. Influence of L-type Ca channel α2/δ-subunit on ionic and gating current in transiently transfected HEK 293 cells. American Journal of Physiology. 1996;270:H1521–1528. - PubMed
-
- Biel M, Ruth P, Bosse E, Hullin R, Stühmer W, Flockerzi V, Hofmann F. Primary structure and functional expression of a high voltage activated calcium channel from rabbit lung. FEBS Letters. 1990;269:409–412. - PubMed
-
- Cribbs LL, Lee J-H, Yang J, Satin J, Zhang Y, Daud A, Barclay J, Williamson MP, Fox M, Rees M, Perez-Reyes E. Cloning and characterization of α1H from human heart, a member of the T-type Ca2+ channel gene family. Circulation Research. 1998;83:103–109. - PubMed
Publication types
MeSH terms
Substances
LinkOut - more resources
Full Text Sources
Molecular Biology Databases
Miscellaneous