. 1999 May 1;516 ( Pt 3)(Pt 3):739-56.
doi: 10.1111/j.1469-7793.1999.0739u.x.

Somatic and prejunctional nicotinic receptors in cultured rat sympathetic neurones show different agonist profiles

Affiliations

Somatic and prejunctional nicotinic receptors in cultured rat sympathetic neurones show different agonist profiles

D Kristufek et al. J Physiol. .

Abstract

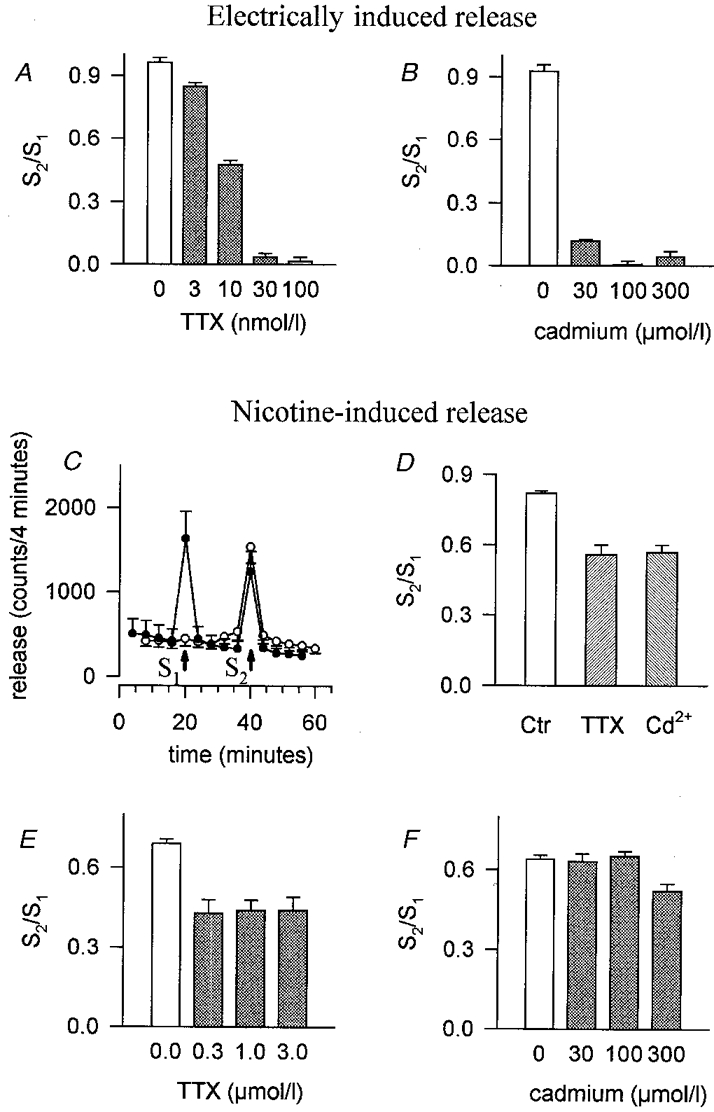
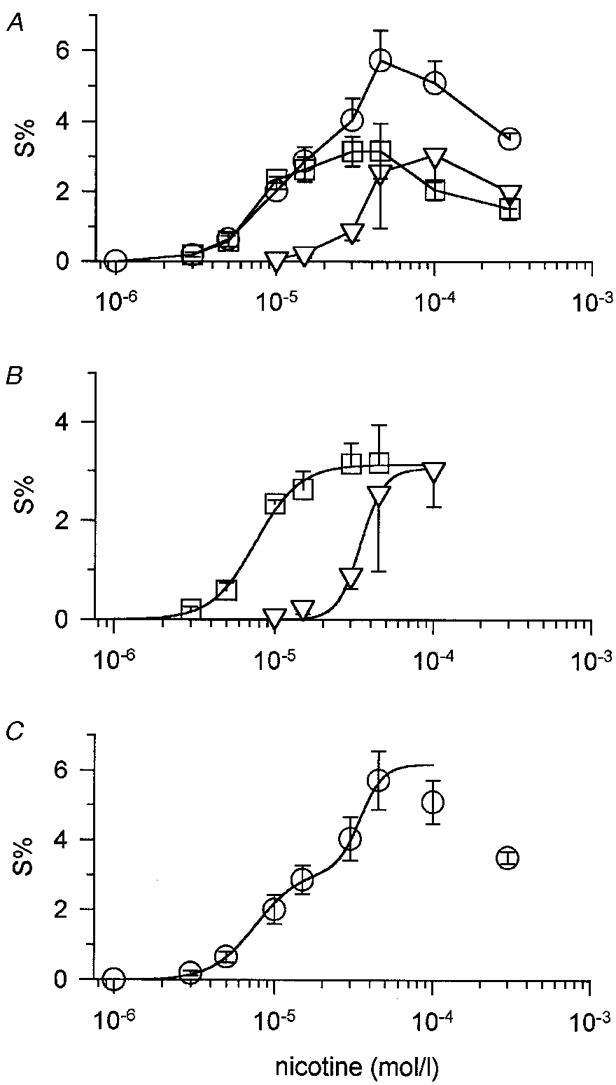
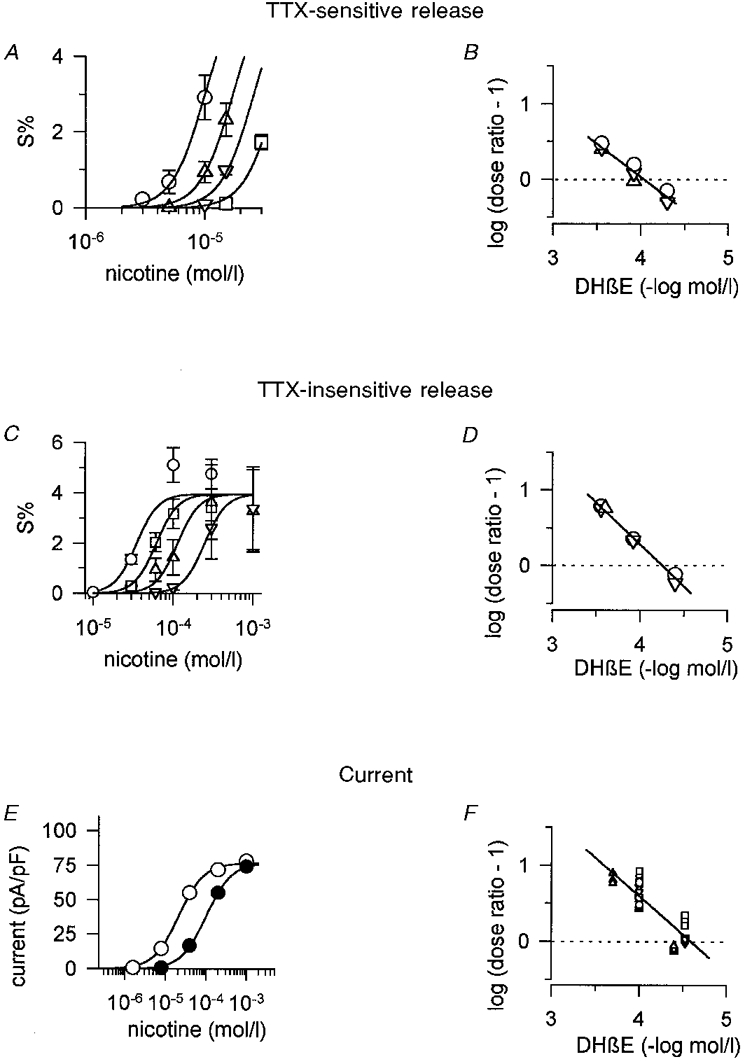
1. The release of [3H]-noradrenaline ([3H]-NA) in response to nicotinic acetylcholine receptor (nAChR) agonists was compared with agonist-induced currents in cultured rat superior cervical ganglion (SCG) neurones. 2. [3H]-NA release in response to high concentrations of nicotinic agonists was reduced, but not fully inhibited, by the presence of either tetrodotoxin (TTX) or Cd2+ to block voltage-gated Na+ or Ca2+ channels, respectively. We used the component of transmitter release that remained in the presence of these substances (named TTX- or Cd2+-insensitive release) to pharmacologically characterize nAChRs in proximity to the sites of vesicular exocytosis (prejunctional receptors). Prejunctional nAChRs were activated by nicotinic agonists with a rank order of potency of dimethylphenylpiperazinium iodide (DMPP) > nicotine > cytisine > ACh, and with EC50 values ranging from 22 microM (DMPP) to 110 microM (ACh). 3. [3H]-NA release in response to low concentrations of nAChR agonists was fully inhibited by the presence of either TTX or Cd2+ (named TTX- or Cd2+-sensitive release). TTX-sensitive release was triggered by nicotinic agonists with a rank order of potency of DMPP > cytisine approximately nicotine approximately ACh, which due to its similarity to TTX-insensitive release indicates that it might also be triggered by prejunctional-type nAChRs. The EC50 values for TTX (Cd2+)-sensitive release were less than 10 microM for all four agonists. 4. By contrast to transmitter release, somatic nAChRs as seen by patch clamp recordings were most potently activated by cytisine, with a rank order of potency of cytisine > nicotine approximately DMPP > ACh. EC50 values for the induction of currents exceeded 20 microM for all four agonists. 5. The nicotinic antagonist mecamylamine potently inhibited all transmitter release in response to nicotine. alpha-Bungarotoxin (alpha-BuTX) was, on the other hand, without significant effect on nicotine-induced TTX-insensitive release. The competitive antagonist dihydro-beta-erythroidine (DHbetaE) caused rightward shifts of the dose-response curves for both TTX-sensitive and TTX-insensitive transmitter release as well as for currents in response to nicotine, with pA2 values ranging from 4.03 to 4.58. 6. Due to clear differences in the pharmacology of agonists we propose that nAChRs of distinct subunit composition are differentially targeted to somatic or axonal domains.


Figures

Figure 1
Figure 1. [3H]-NA release in response to electrical field stimulation or nicotine: effects of TTX and Cd2+
A, effect of TTX on S2/S1 ratios of transmitter release induced by electrical field stimulation. Indicated concentrations of TTX were added to the superfusion buffer 8 min before and during the second stimulus, S2. Means and s.e.m., n = 6-15 individual cultures. B, effect of Cd2+ on S2/S1 ratios of transmitter release induced by electrical field stimulation. Indicated concentrations of Cd2+ were added to the superfusion buffer 8 min before and during S2. Means and s.e.m., n = 6. C, basal transmitter release, and the release induced by 100 μM nicotine (15 s, indicated by arrows). •, control buffer containing 2 mM Ca2+; ○, superfusion buffer without (arrow at 20 min) or with (arrow at 40 min) 2 mM Ca2+. Means and s.e.m., n = 3. D, effects of 1 μM TTX or 100 μM Cd2+ on S2/S1 ratios of transmitter release induced by 100 μM nicotine. TTX or Cd2+ was added to the superfusion buffer 8 min before and during S2. Means and s.e.m., n = 12 (control, Ctr) or 6 (TTX and Cd2+). S2/S1 ratios in the presence of TTX or Cd2+ do not differ significantly (P > 0.05, Mann-Whitney test). E, effect of TTX on S2/S1 ratios of transmitter release induced by 100 μM nicotine. Indicated concentrations of TTX were added to the superfusion buffer 8 min before and during S2. Means and s.e.m., n = 6. F, effect of Cd2+ on S2/S1 ratios of transmitter release induced by 100 μM nicotine in the presence of TTX. TTX (1 μM) was included in the superfusion buffer throughout the collection of the fractions. Indicated concentrations of Cd2+ were added to the superfusion buffer 8 min before and during S2. S2/S1 ratios in the presence of Cd2+ differ from S2/S1 ratios of controls only at 300 μM Cd2+ (P < 0.01, Mann-Whitney test). Data are means and s.e.m., n = 6.
Figure 2
Figure 2. Concentration-response curves of nicotine-induced TTX-sensitive and TTX-insensitive transmitter release
A, nicotine-induced transmitter release under control conditions (overall release, ○) and in the presence of 1 μM TTX (TTX-insensitive release, ▿). Data are means and s.e.m., n = 3-7 platings, each including 3 or 6 individual culture discs. Data points indicated by squares were obtained by subtracting mean values of nicotine-induced TTX-insensitive release (▿) from overall release (○) for the same experiment and represent TTX-sensitive release (see text). B, curve fits of TTX-sensitive (□) and TTX-insensitive release (▿). Data points were taken from A. Curves were fitted to data points using eqn (1) described in Methods. Apparent affinities for nicotine were 7.60 and 34.6 μM for TTX-sensitive and TTX-insensitive release, respectively. C, concentration dependence of nicotine-induced transmitter release under control conditions (overall release, as shown in A). The curve was obtained by summation of the two fitted curves for nicotine-induced TTX-sensitive and TTX-insensitive release shown in B.
Figure 3
Figure 3. Concentration-response curves of transmitter release induced by nicotinic agonists
Aa, DMPP-induced transmitter release under control conditions (overall release, ○) and in the presence of 300 μM Cd2+ (Cd2+-insensitive release, ▿). Data are means and s.e.m. (plotted only when exceeding symbol size), n = 4-7 platings, each including 3 individual culture discs, except for 3 and 300 μM DMPP in the presence of Cd2+ (n = 2). Data points indicated by squares (Cd2+-sensitive release) were obtained by subtracting DMPP-induced release in the presence of Cd2+ (▿) from overall release (○) in the same experiment. The sum of Cd2+-sensitive and Cd2+-insensitive release may not exactly match overall release in this figure, since a greater number of experiments were pooled for constructing overall as compared with Cd2+-sensitive release (note e.g. data points at 100 μM DMPP). Ab, curve fits of Cd2+-sensitive (□) and Cd2+-insensitive (▿) DMPP-induced transmitter release. Data points were taken from Aa. Curves were fitted to data points using eqn (1). Apparent affinities for DMPP were 3.86 and 22.4 μM for Cd2+-sensitive and Cd2+-insensitive release, respectively. Ba, cytisine-induced transmitter release under control conditions (overall release, ○) and in the presence of 300 μM Cd2+ (Cd2+-insensitive release, ▿). Data are means and s.e.m., n = 3 platings, each including 3 or 6 individual culture discs. Data points indicated by squares were obtained by subtracting cytisine-induced release in the presence of Cd2+ (▿) from overall release (○) for the same experiment. Bb, curve fits of Cd2+-sensitive (□) and Cd2+-insensitive (▿) cytisine-induced transmitter release. Data points were taken from Ba. Curves were fitted to data points using eqn (1). Apparent affinities for cytisine were 7.01 and 48.7 μM for Cd2+-sensitive and Cd2+-insensitive release, respectively. Ca, ACh-induced transmitter release under control conditions (overall release, ○) and in the presence of 300 μM Cd2+ (Cd2+-insensitive release, ▿). Data are means and s.e.m., n = 3-8 platings, each including 3 individual culture discs. Data points indicated by squares were obtained by subtracting ACh-induced release in the presence of Cd2+ (▿) from overall release (○) for the same experiment. Cb, curve fits of Cd2+-sensitive (□) and Cd2+-insensitive (▿) ACh-induced transmitter release. Data points were taken from Ca. Curves were fitted to data points using eqn (1). Apparent affinities for ACh were 7.45 and 110.6 μM for Cd2+-sensitive and Cd2+-insensitive release, respectively. D, partial concentration-response curves of TTX-sensitive transmitter release induced by DMPP (▵), cytisine (▿), nicotine (○) and ACh (□) in a single experiment made up of 12 individual culture discs. Indicated concentrations of agonists, each tested in one triplet of culture discs, were added at 20 min intervals. Data points are means from 3 individual discs. Error bars (s.e.m.) did not exceed symbols. Curves were simultaneously fitted to data points with the ALLFIT routine with the constraints of a shared slope and a fixed maximum as described in Methods. Potency ratios relative to the standard (DMPP) were 0.51 for nicotine, 0.47 for cytisine and 0.36 for ACh. Averaged potency ratios from identically designed experiments are provided in Table 2A. Note that agonist concentrations employed will only induce TTX-sensitive transmitter release. E, partial concentration-response curves of TTX-insensitive transmitter release induced by DMPP (▵), cytisine (▿), nicotine (○) and ACh (□) in a single experiment in the presence of 1 μM TTX. Agonists at indicated concentrations were each added to one triplet of culture discs as described for D. Data points are means from 3 individual culture discs. Error bars (s.e.m.) did not exceed symbol size. Curves were simultaneously fitted to data points with the ALLFIT routine with the constraints of a shared slope and a fixed maximum. Potency ratios relative to the standard (DMPP) were 0.87 for nicotine, 0.61 for cytisine and 0.14 for ACh. Averaged potency ratios from identically designed experiments are provided in Table 2C.
Figure 4
Figure 4. Examples of agonist-induced whole-cell currents at a concentration range that covers saturating responses
Aa and Ba, original traces of currents induced by DMPP, ACh, nicotine and cytisine in 2 different cells (A and B). Pairs of indicated agonists were tested in cells voltage clamped at -70 mV using the perforated patch technique as described in Methods. Agonists were applied at concentrations indicated in Ab and Bb. Ab and Bb, dose-response relationship of peak currents constructed from the original recordings shown in Aa and Ba. Data points are mean peak currents measured in duplicate (□, ACh; ▵, DMPP; ○, nicotine; ▿, cytisine). Curves fitted to data points by means of eqn (1) revealed EC50 values of 19.7 μM for DMPP, 96.4 μM for ACh, 28.5 μM for nicotine and 22.2 μM for cytisine. A summary of related experiments is provided in Table 1A.
Figure 5
Figure 5. Examples of agonist-induced whole-cell currents elicited at the low-concentration end of the dose-response curve
A, original traces of currents induced by DMPP, ACh, nicotine and cytisine. Currents were recorded in the same cell by the perforated patch technique as described in Methods, except that application times were extended to 15 s. The cell was voltage clamped at -70 mV. Apart from ACh (4 μM), agonist concentrations for the effects shown were 3 μM. B, dose-response relationship of peak currents constructed from original recordings as shown in A. Data points are mean peak currents measured in duplicate for each agonist. Curves based on eqn (1) were simultaneously fitted to data points by weighted non-linear regression using the ALLFIT routine with the constraints of a shared slope and a fixed maximum as described in Methods. Potency ratios relative to the standard (DMPP, ▵) were 1.33 for cytisine (▿), 0.69 for nicotine (○) and 0.46 for ACh (□). Note that numbers > 1 mean potencies greater than DMPP (i.e. larger effects at equal concentrations). Averaged potency ratios from identically designed experiments are provided in Table 2E. C, dose-response relationship constructed from original recordings as shown in A, but based on a 15 s time integral (i.e. the area under the curve during a 15 s application of agonist) instead of measuring peak currents as shown in B. Data points are mean 15 s time integrals of currents measured in duplicate for each agonist. Potency ratios relative to DMPP (▵) were 1.61 for cytisine (▿), 0.84 for nicotine (○) and 0.57 for ACh (□), calculated by the same method as described in B. Averaged potency ratios from identically designed experiments are provided in Table 2F.
Figure 6
Figure 6. Effects of mecamylamine on nicotine-induced transmitter release
A, nicotine-induced transmitter release under control conditions (overall release, ○), and in the presence of 100 nM mecamylamine (•), 300 nM mecamylamine (▴) and 1 μM mecamylamine (▾). Note that inhibition by mecamylamine depends on the concentration of nicotine. Data are means and s.e.m. (only shown when exceeding symbol size), n = 6 individual cultures. B, insurmountable inhibition of Cd2+-insensitive transmitter release by 30 nM and 1 μM mecamylamine. Transmitter release was induced by the indicated concentrations of nicotine in the presence of 300 μM Cd2+ and in the absence (control, ○) or continuous presence of 30 nM (•) or 1 μM (▾) mecamylamine. Data are means ±s.e.m. (only shown when exceeding symbol size), n = 3-5. C, effects of mecamylamine on overall and on Cd2+-insensitive, nicotine-induced transmitter release. Transmitter release was induced by 2 successive stimuli of 100 μM nicotine (S1, S2) in the absence (overall release, ▵) or presence of 300 μM Cd2+ (Cd2+-insensitive release, ▿) and indicated concentrations of mecamylamine added to the superfusion buffer 8 min before and during S2. S2/S1 ratios in the presence of mecamylamine were compared with S2/S1 ratios under control conditions. Data are mean values of percentage inhibition (s.e.m. did not exceed symbol size), n = 3-6. The curves were fitted to data points by means of eqn (1) with fixed parameters for maximum (100 % inhibition) and minimum (0 %). Curve fits yielded IC50 values of 0.083 and 0.026 μM mecamylamine for overall and Cd2+-insensitive release, respectively.
Figure 7
Figure 7. Effects of DHβE on nicotine-induced transmitter release and on nicotine-induced currents
A, TTX-sensitive transmitter release induced by indicated concentrations of nicotine in the absence (○) or presence of 50 μM (▵), 120 μM (▿) and 280 μM DHβE (□). Unlike other antagonists, DHβE was added to the superfusion buffer only in combination with nicotine. Curves based on eqn (1) were simultaneously fitted to data points using the ALLFIT routine with the constraints of a shared slope and a fixed maximum as described in Methods. Curve shifts (dose ratios) caused by 50, 120 and 280 μM DHβE were 1.71, 2.58 and 4.02, respectively. Data are means ±s.e.m., n = 3 individual culture discs. Note that by selecting low concentrations, nicotine will primarily induce TTX-sensitive transmitter release (compare with C and Fig. 2). B, Schild plot of data shown in A and 2 additional, identically designed experiments. Dose ratios were calculated from curve shifts in the presence of a given concentration of the antagonist by fitting data points to eqn (1) as shown in A. Different symbols indicate 3 different release experiments. The line fitted to the data points has a slope of -0.87 ± 0.08 (estimate ±s.e.m.) which does not significantly differ from unity, as the confidence interval of the estimate of the slope included 1 at the 5 % significance level. It intersects the dotted line at 4.03 (pA2 value). C, TTX-insensitive transmitter release induced by the indicated concentrations of nicotine in the absence (○) or presence of 40 μM (□), 120 μM (▵) and 280 μM DHβE (▿). Cultures were continuously superfused with TTX-containing buffer, whereas the antagonist was added to the superfusion buffer just in combination with nicotine. Curves based on eqn (1) were simultaneously fitted to data points using the ALLFIT routine with the constraints of a shared slope and a shared maximum. Curve shifts (dose ratios) caused by 40, 120 and 280 μM DHβE were 1.76, 3.24 and 7.08, respectively. Data are means ±s.e.m., n = 3 individual culture discs. D, Schild plot of data shown in C and 2 additional, similarly designed experiments. Dose ratios were calculated from curve shifts in the presence of a given concentration of the antagonist by fitting data points to eqn (1) as shown in C. Different symbols indicate 3 different release experiments. The line fitted to the data points has a slope of -1.13 ± 0.04 (estimate ±s.e.m.) which significantly differs from unity, as the confidence interval of the estimate for the slope did not include 1 at the 5 % significance level. It intersects the dotted line at 4.25 (pA2 value). E, whole-cell currents elicited by indicated concentrations of nicotine in the absence (control, ○) or presence (•) of 100 μM DHβE at a holding potential of -70 mV. Data points are averaged peak currents of measurements in triplicate in a typical cell. In order to match observations on transmitter release, DHβE was applied only in combination with nicotine without the otherwise practised 10 s pre-exposure of cells to antagonists (see Methods). Curves based on eqn (1) were simultaneously fitted to data points using the ALLFIT routine with the constraints of a shared slope and a shared maximum. The curve shift (dose ratio) caused by DHβE was 4.74. F, Schild plot of data obtained by patch clamp recordings from 17 different cells (including the one shown in A). Dose ratios were calculated from curve shifts in the presence of a given concentration of the antagonist by fitting data points to eqn (1) as shown in A. Different symbols indicate recordings from 4 different days. Curve shifts at the low-concentration end of the nicotine dose-response curve were used if more than one (up to 3) concentration of DHβE was tested in one cell. The line fitted to the data points has a slope of -1.01 ± 0.1 (estimate ±s.e.m.), which does not significantly differ from unity, as the confidence interval of the estimate for the slope included 1 at the 5 % significance level. It intersects the dotted line at 4.58 (pA2 value).

Similar articles

Cited by

References

    1. Arunlakshana O, Schild HO. Some quantitative uses of drug antagonists. British Journal of Pharmacology. 1959;14:48–58. - PMC - PubMed
    1. Ascher P, Large WA, Rang HP. Studies on the mechanism of action of acetylcholine antagonists on rat parasympathetic ganglion cells. The Journal of Physiology. 1979;295:139–170. - PMC - PubMed
    1. Bernheim L, Mathie A, Hille B. Characterization of muscarinic receptor subtypes inhibiting Ca2+ current and M current in rat sympathetic neurons. Proceedings of the National Academy of Sciences of the USA. 1992;89:9544–9548. - PMC - PubMed
    1. Boehm S, Huck S. α2-Adrenoreceptor-mediated inhibition of acetylcholine-induced noradrenaline release from rat sympathetic neurons: an action at voltage-gated Ca2+ channels. Neuroscience. 1995;69:221–231. - PubMed
    1. Boehm S, Huck S. Receptors controlling transmitter release from sympathetic neurons in vitro. Progress in Neurobiology. 1997;51:225–242. - PubMed

Publication types

MeSH terms

LinkOut - more resources