

Contribution of baroreceptors and chemoreceptors to ventricular hypertrophy produced by sino-aortic denervation in rats
- PMID: 10200434
- PMCID: PMC2269302
- DOI: 10.1111/j.1469-7793.1999.0885u.x
Contribution of baroreceptors and chemoreceptors to ventricular hypertrophy produced by sino-aortic denervation in rats
Abstract
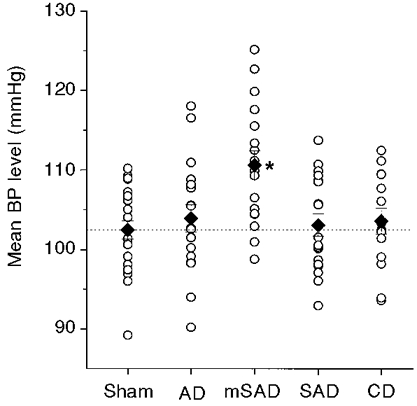
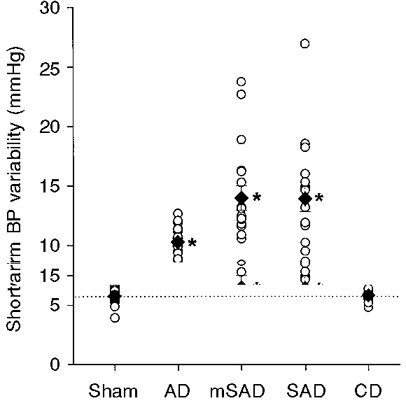
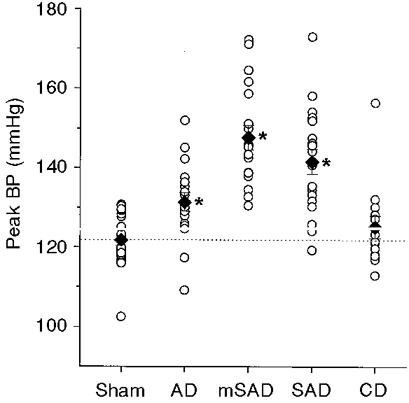
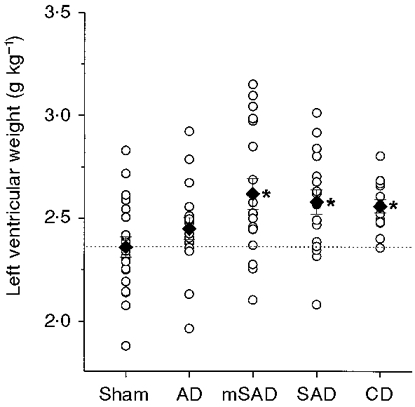
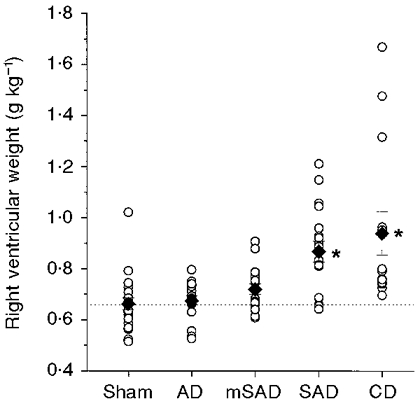
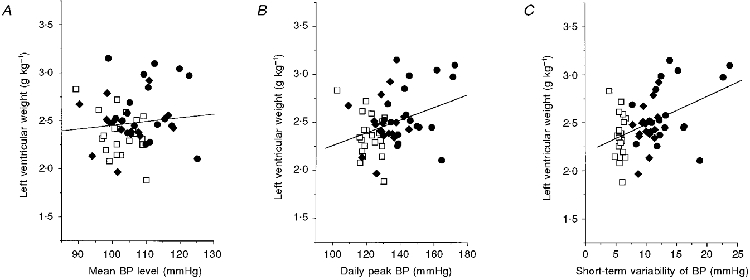
1. To test whether sino-aortic denervation (SAD)-induced right ventricular hypertrophy (RVH) is a consequence of baroreceptor or chemoreceptor denervation, we compared the effects of aortic denervation (AD), carotid denervation (CD), SAD and a SAD procedure modified to spare the carotid chemoreceptors (mSAD), 6 weeks after denervation surgery in rats. A sham surgery group served as the control. 2. The blood pressure (BP) level was unaffected by AD, CD or SAD, but increased (9 %) following mSAD. The mean heart rate level was not affected. Short-term BP variability was elevated following AD (81 %), SAD (144 %) and mSAD (146 %), but not after CD. Baroreflex heart rate responses to phenylephrine were attenuated in all denervation groups. 3. Significant RVH occurred only following CD and SAD. These procedures also produced high mortality (CD and SAD) and significant increases in right ventricular pressures and haematocrit (CD). 4. Significant left ventricular hypertrophy occurred following CD, SAD and mSAD. Normalized left ventricular weight was significantly correlated with indices of BP variability. 5. These results suggest that SAD-induced RVH is a consequence of chemoreceptor, not baroreceptor, denervation. Our results also demonstrate that a mSAD procedure designed to spare the carotid chemoreceptors produced profound baroreflex dysfunction and significant left, but not right, ventricular hypertrophy.
Figures
Similar articles
-
Selective denervation of the aortic and carotid baroreceptors in rats.Exp Physiol. 2019 Sep;104(9):1335-1342. doi: 10.1113/EP087764. Epub 2019 Jul 7. Exp Physiol. 2019. PMID: 31161612
-
Carotid chemoreceptors influence arterial pressure in intact and aortic-denervated rats.Am J Physiol. 1992 Apr;262(4 Pt 2):R677-83. doi: 10.1152/ajpregu.1992.262.4.R677. Am J Physiol. 1992. PMID: 1566935
-
The importance of blood pressure variability in rat aortic and left ventricular hypertrophy produced by sinoaortic denervation.J Hypertens. 2002 Sep;20(9):1865-72. doi: 10.1097/00004872-200209000-00033. J Hypertens. 2002. PMID: 12195130
-
Denervation of carotid baro- and chemoreceptors in humans.J Physiol. 2003 Nov 15;553(Pt 1):3-11. doi: 10.1113/jphysiol.2003.052415. Epub 2003 Oct 3. J Physiol. 2003. PMID: 14528027 Free PMC article. Review.
-
Possible Breathing Influences on the Control of Arterial Pressure After Sino-aortic Denervation in Rats.Curr Hypertens Rep. 2018 Jan 22;20(1):2. doi: 10.1007/s11906-018-0800-3. Curr Hypertens Rep. 2018. PMID: 29356918 Review.
Cited by
-
Renin angiotensin system and cardiac hypertrophy after sinoaortic denervation in rats.Clinics (Sao Paulo). 2010;65(12):1345-50. doi: 10.1590/s1807-59322010001200019. Clinics (Sao Paulo). 2010. PMID: 21340225 Free PMC article.
-
Neural control of arterial pressure variability in the neuromuscularly blocked rat.Eur J Appl Physiol. 2012 Jun;112(6):2013-24. doi: 10.1007/s00421-011-2160-4. Epub 2011 Sep 23. Eur J Appl Physiol. 2012. PMID: 21947406
-
Development of an Experimental Model to Study the Relationship Between Day-to-Day Variability in Blood Pressure and Aortic Stiffness.Front Physiol. 2015 Dec 8;6:368. doi: 10.3389/fphys.2015.00368. eCollection 2015. Front Physiol. 2015. PMID: 26696902 Free PMC article.
-
Chronic Interactions Between Carotid Baroreceptors and Chemoreceptors in Obesity Hypertension.Hypertension. 2016 Jul;68(1):227-35. doi: 10.1161/HYPERTENSIONAHA.116.07232. Epub 2016 May 9. Hypertension. 2016. PMID: 27160198 Free PMC article.
-
Arterial baroreflex control of muscle blood flow at the onset of voluntary locomotion in mice.J Physiol. 2003 Nov 15;553(Pt 1):191-201. doi: 10.1113/jphysiol.2003.047530. Epub 2003 Aug 22. J Physiol. 2003. PMID: 12937292 Free PMC article.
References
-
- Boyd JD, McCullagh GP. Experimental hypertension following carotico-aortic denervation in the rabbit. Quarterly Journal of Experimental Physiology. 1938;27:293–307.
-
- Buchholz RA, Hubbard JW, Nathan MA. Comparison of 1-hour and 24-hour pressure recordings in central or peripheral baroreceptor-denervated rats. Hypertension. 1986;8:1154–1163. - PubMed
-
- Cardenas H, Zapata P. Ventilatory reflexes originating from carotid and extracarotid chemoreceptors in rats. American Journal of Physiology. 1983;244:R119–125. - PubMed
-
- Dammin GJ, Goldman ML, Schroeder HA, Pace MG. Arterial hypertension in dogs. II. The effects of neurogenic hypertension with a study of periodic renal biopsies over a seven year period. Laboratory Investigation. 1956;5:72–96. - PubMed
Publication types
MeSH terms
Substances
LinkOut - more resources
Full Text Sources
Other Literature Sources