

Effect of a 17 day spaceflight on contractile properties of human soleus muscle fibres
- PMID: 10200437
- PMCID: PMC2269300
- DOI: 10.1111/j.1469-7793.1999.0915u.x
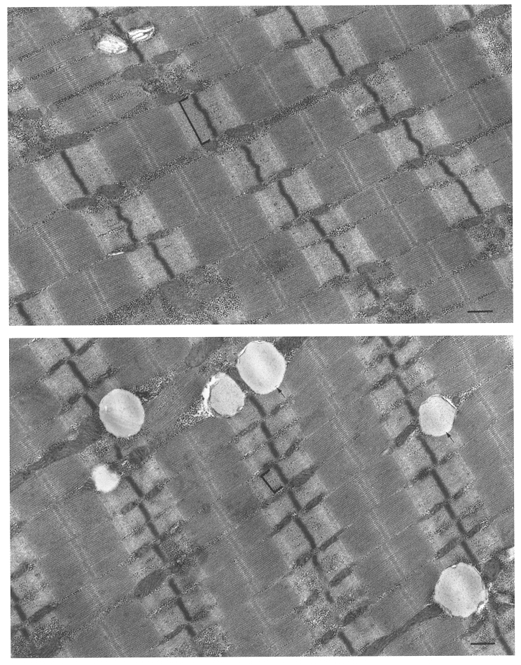
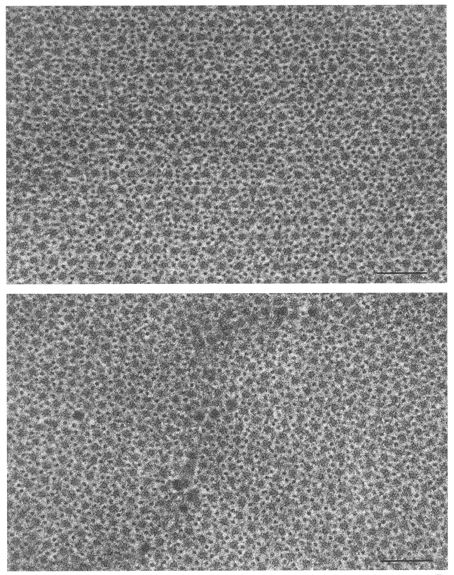
Effect of a 17 day spaceflight on contractile properties of human soleus muscle fibres
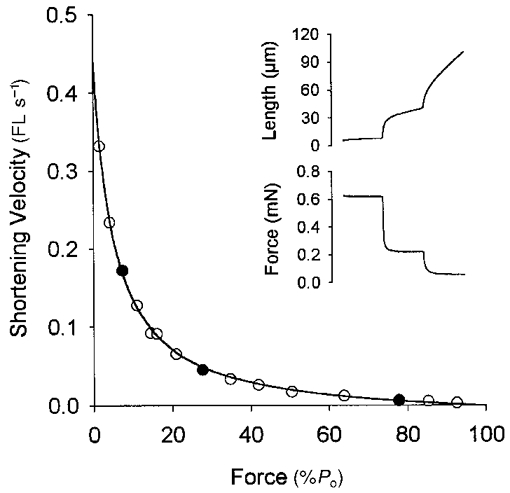
Abstract
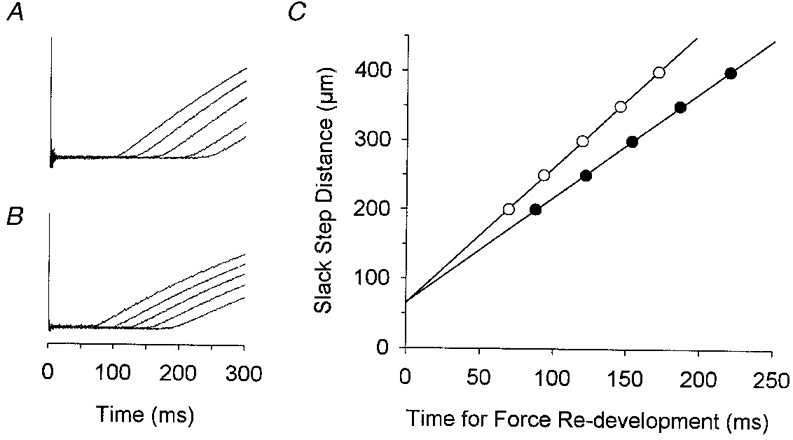
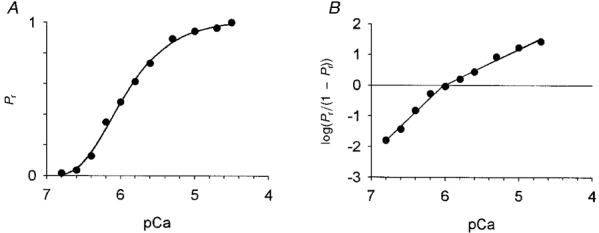
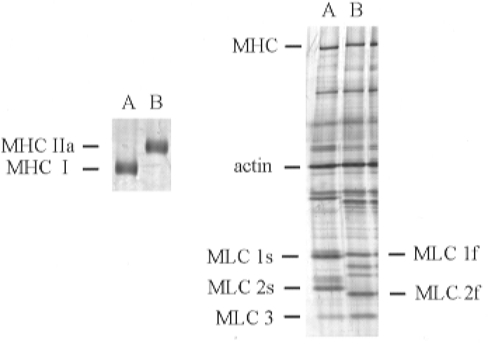
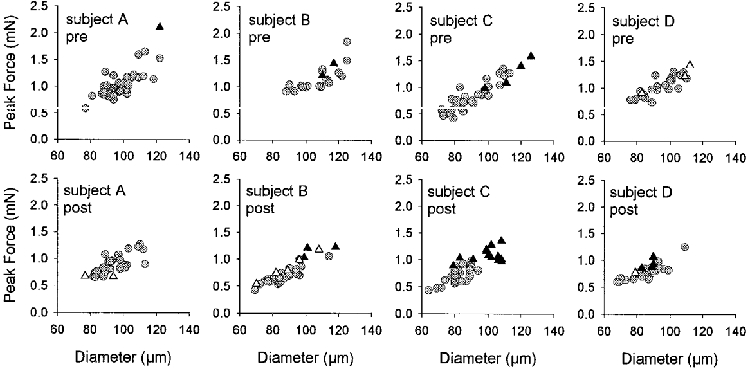
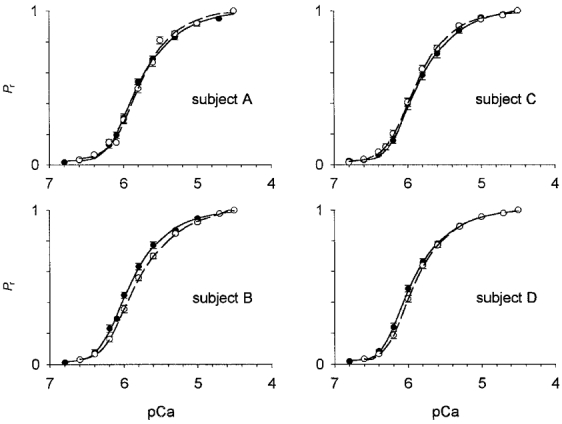
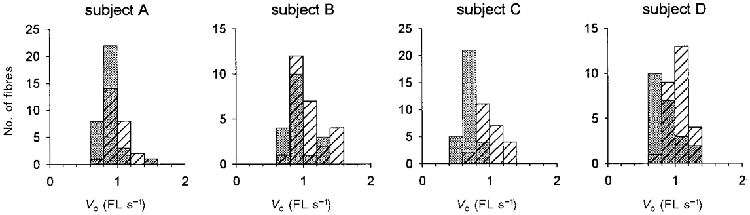
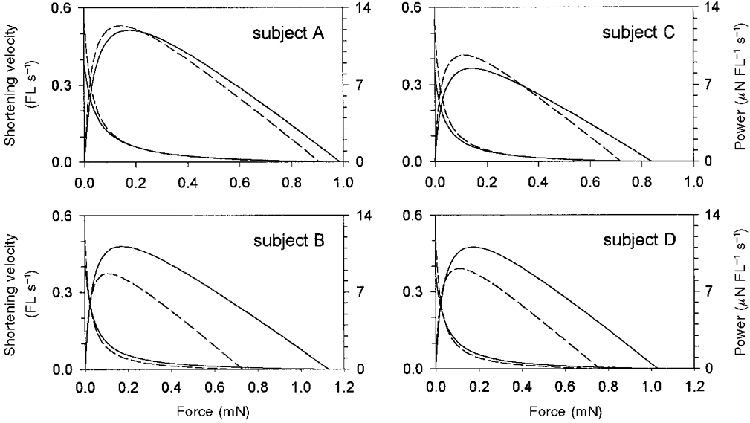
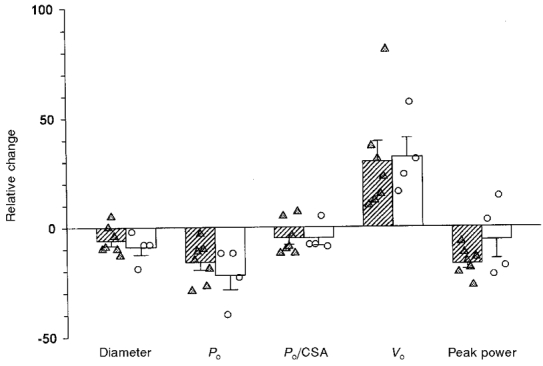
1. Soleus biopsies were obtained from four male astronauts 45 days before and within 2 h after a 17 day spaceflight. 2. For all astronauts, single chemically skinned post-flight fibres expressing only type I myosin heavy chain (MHC) developed less average peak Ca2+ activated force (Po) during fixed-end contractions (0.78 +/- 0. 02 vs. 0.99 +/- 0.03 mN) and shortened at a greater mean velocity during unloaded contractions (Vo) (0.83 +/- 0.02 vs. 0.64 +/- 0.02 fibre lengths s-1) than pre-flight type I fibres. 3. The flight-induced decline in absolute Po was attributed to reductions in fibre diameter and/or Po per fibre cross-sectional area. Fibres from the astronaut who experienced the greatest relative loss of peak force also displayed a reduction in Ca2+ sensitivity. 4. The elevated Vo of the post-flight slow type I fibres could not be explained by alterations in myosin heavy or light chain composition. One alternative possibility is that the elevated Vo resulted from an increased myofilament lattice spacing. This hypothesis was supported by electron micrographic analysis demonstrating a reduction in thin filament density post-flight. 5. Post-flight fibres shortened at 30 % higher velocities than pre-flight fibres at external loads associated with peak power output. This increase in shortening velocity either reduced (2 astronauts) or prevented (2 astronauts) a post-flight loss in fibre absolute peak power (microN (fibre length) s-1). 6. The changes in soleus fibre diameter and function following spaceflight were similar to those observed after 17 days of bed rest. Although in-flight exercise countermeasures probably reduced the effects of microgravity, the results support the idea that ground-based bed rest can serve as a model of human spaceflight. 7. In conclusion, 17 days of spaceflight decreased force and increased shortening velocity of single Ca2+-activated muscle cells expressing type I MHC. The increase in shortening velocity greatly reduced the impact that impaired force production had on absolute peak power.
Figures
References
-
- Allen DL, Yasui W, Tanaka T, Ohira Y, Nagaoka S, Sekiguchi C, Hinds WE, Roy RR, Edgerton VR. Myonuclear number and myosin heavy chain expression in rat soleus single muscle fibers after spaceflight. Journal of Applied Physiology. 1996;81:145–151. - PubMed
-
- Bangart JJ, Widrick JJ, Fitts RH. Effect of intermittent weight bearing on soleus fiber force-velocity-power and force-pCa relationships. Journal of Applied Physiology. 1997;82:1905–1910. 10.1063/1.365997. - DOI - PubMed
-
- Caiozzo VJ, Haddad F, Baker MJ, Herrick RE, Prietto N, Baldwin KM. Microgravity-induced transformations of myosin isoforms and contractile properties of skeletal muscle. Journal of Applied Physiology. 1996;81:123–132. - PubMed
-
- Campione M, Ausoni S, Guezennec CY, Schiaffino S. Myosin and troponin changes in rat soleus muscle after hindlimb suspension. Journal of Applied Physiology. 1993;74:1156–1160. - PubMed
-
- Convertino VA. Physiological adaptations to weightlessness: effects on exercise and work performance. In: Pandolf KB, Holloszy JO, editors. Exercise and Sports Sceinces Reviews. Vol. 18. Baltimore: Williams and Wilkins; 1990. pp. 119–166. - PubMed
Publication types
MeSH terms
Substances
LinkOut - more resources
Full Text Sources
Research Materials
Miscellaneous