

Serological discrimination of dogs infected with gastric Helicobacter spp. and uninfected dogs
- PMID: 10203471
- PMCID: PMC84751
- DOI: 10.1128/JCM.37.5.1280-1287.1999
Serological discrimination of dogs infected with gastric Helicobacter spp. and uninfected dogs
Abstract
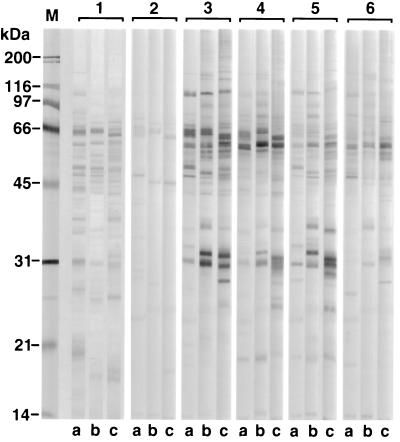
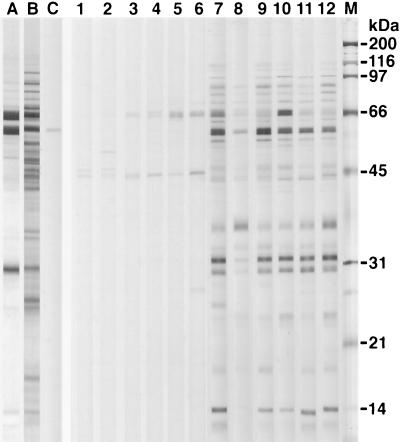
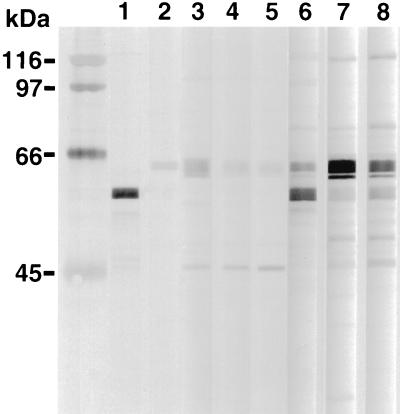
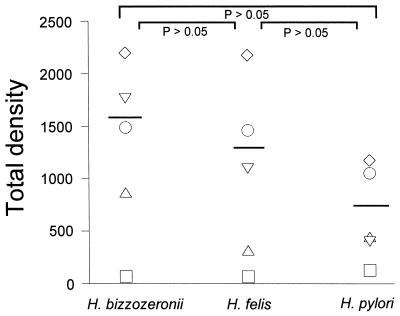
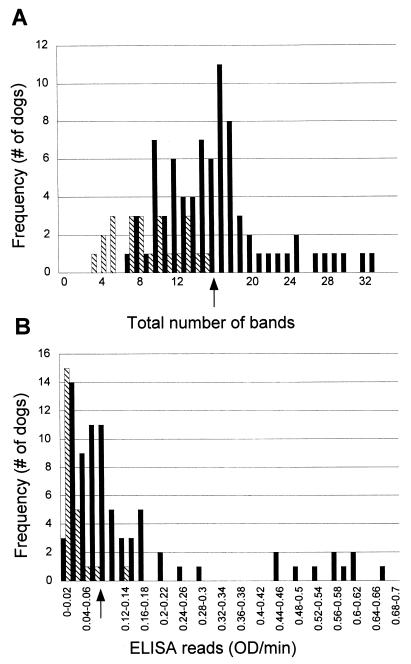
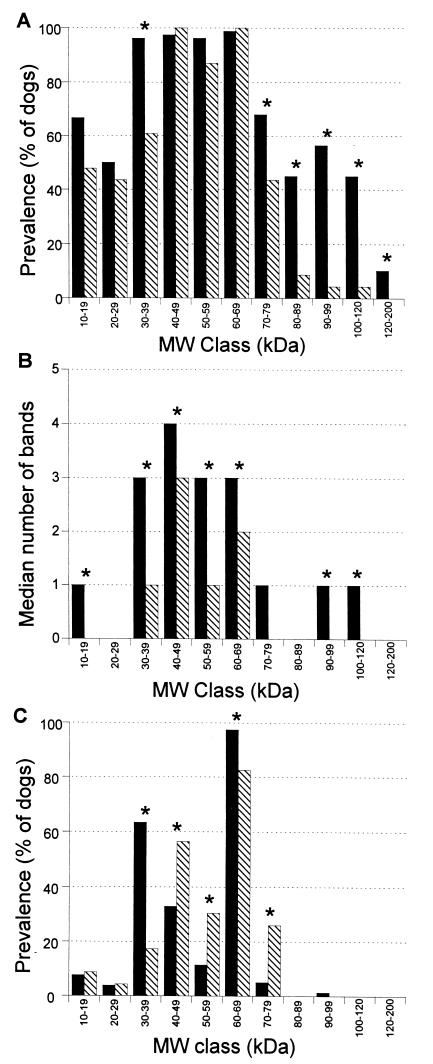
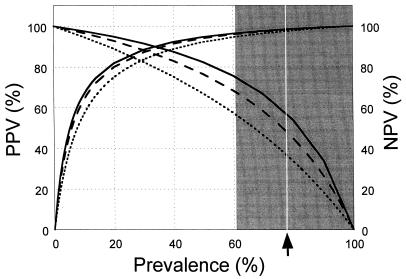
Characterization of the humoral immune responses of people to Helicobacter pylori infection has facilitated the investigation of the host response to bacterial virulence factors and the development of sensitive and specific diagnostic tests. Dogs are commonly infected with gastric Helicobacter spp., but the presence of multiple Helicobacter spp. and possible coinfection in individual dogs have complicated serological evaluation. Evaluation of the antigenic homology of Helicobacter spp. revealed that the major protein bands of Helicobacter felis and Helicobacter bizzozeronii, two Helicobacter spp. that infect dogs, were very similar to UreA (29 to 31 kDa), UreB (63 to 66 kDa), and HSP (58 to 60 kDa) of H. pylori, and sera from infected and uninfected dogs bound in a similar way to each antigen. Immunoblotting and an enzyme-linked immunosorbent assay (ELISA) with H. felis ATCC 49179 antigen were performed with 101 serum samples (from 78 infected dogs and 23 uninfected dogs). Samples from uninfected dogs (median = 8) had fewer bands on immunoblotting than samples from infected dogs (median = 16) (P < 0.05). Combinations of the presence of any two of the low-molecular-mass bands (19, 25, 30, 32, and 37 kDa) or the high-molecular-mass bands (86 and 94 kDa) were found almost solely in samples from infected dogs (P < 0.0001). Kinetic ELISA results were significantly higher for samples from infected dogs (median = 0. 0802 optical density unit [OD]/min) than for samples from uninfected dogs (median = 0.01428 OD/min). The combination of ELISA and immunoblotting results gave a specificity of 95.6% and a sensitivity of 79.8%. No correlation between ELISA results, colonization density, degree of inflammation, and presence of lymphoid follicles was observed. The results indicate substantial antigenic homology between H. felis, H. pylori, and H. bizzozeronii. The combination of ELISA and immunoblotting was a highly specific and moderately sensitive indicator of infection. The degree of seropositivity assessed by ELISA was not related to bacterial colonization density, the degree of gastric inflammation, or the presence of lymphoid follicles.
Figures
Similar articles
-
Helicobacter spp. infection in cats: evaluation of the humoral immune response and prevalence of gastric Helicobacter spp.Vet Microbiol. 2001 Apr 2;79(3):253-65. doi: 10.1016/s0378-1135(00)00360-6. Vet Microbiol. 2001. PMID: 11240103
-
Serological responses of FldA and small-molecular-weight proteins of Helicobacter pylori: correlation with the presence of the gastric MALT tissue.Helicobacter. 2004 Feb;9(1):81-6. doi: 10.1111/j.1083-4389.2004.00201.x. Helicobacter. 2004. PMID: 15156908
-
Antigenic proteins of Helicobacter pylori of potential diagnostic value.Asian Pac J Cancer Prev. 2013;14(3):1635-42. doi: 10.7314/apjcp.2013.14.3.1635. Asian Pac J Cancer Prev. 2013. PMID: 23679248
-
Helicobacter infection in dogs and cats: facts and fiction.J Vet Intern Med. 2000 Mar-Apr;14(2):125-33. doi: 10.1892/0891-6640(2000)014<0125:iidacf>2.3.co;2. J Vet Intern Med. 2000. PMID: 10772482 Review.
-
Accurate diagnosis of Helicobacter pylori. Serologic testing.Gastroenterol Clin North Am. 2000 Dec;29(4):853-62. doi: 10.1016/s0889-8553(05)70152-7. Gastroenterol Clin North Am. 2000. PMID: 11190069 Review.
Cited by
-
Canine gastritis.Vet Clin North Am Small Anim Pract. 2003 Sep;33(5):969-85, v-vi. doi: 10.1016/s0195-5616(03)00052-4. Vet Clin North Am Small Anim Pract. 2003. PMID: 14552157 Free PMC article. Review.
-
Helicobacter Species and Their Association with Gastric Pathology in a Cohort of Dogs with Chronic Gastrointestinal Signs.Animals (Basel). 2022 May 13;12(10):1254. doi: 10.3390/ani12101254. Animals (Basel). 2022. PMID: 35625100 Free PMC article.
-
Helicobacter species detection and histopathological changes in stray cats from Niterói, Brazil.J Feline Med Surg. 2010 Jun;12(6):509-11. doi: 10.1016/j.jfms.2010.01.008. Epub 2010 Mar 12. J Feline Med Surg. 2010. PMID: 20223691 Free PMC article.
-
Emergence of diverse Helicobacter species in the pathogenesis of gastric and enterohepatic diseases.Clin Microbiol Rev. 2001 Jan;14(1):59-97. doi: 10.1128/CMR.14.1.59-97.2001. Clin Microbiol Rev. 2001. PMID: 11148003 Free PMC article. Review.
References
-
- Bizzozero G. Sulla presenza di batteri nelle ghiandole gastriche del cane. Atti R Accad Sci Torino. 1893;28:249–251.
-
- Blaser M J. The bacteria behind ulcers. Sci Am. 1996;274:103–107. - PubMed
Publication types
MeSH terms
Substances
LinkOut - more resources
Full Text Sources
Other Literature Sources
Medical
Molecular Biology Databases
Miscellaneous
