. 1999 Apr 1;71(7):1241-51.
doi: 10.1021/ac981301i.

Polarization sensing with visual detection

Affiliations

Polarization sensing with visual detection

I Gryczynski et al. Anal Chem. .

Abstract

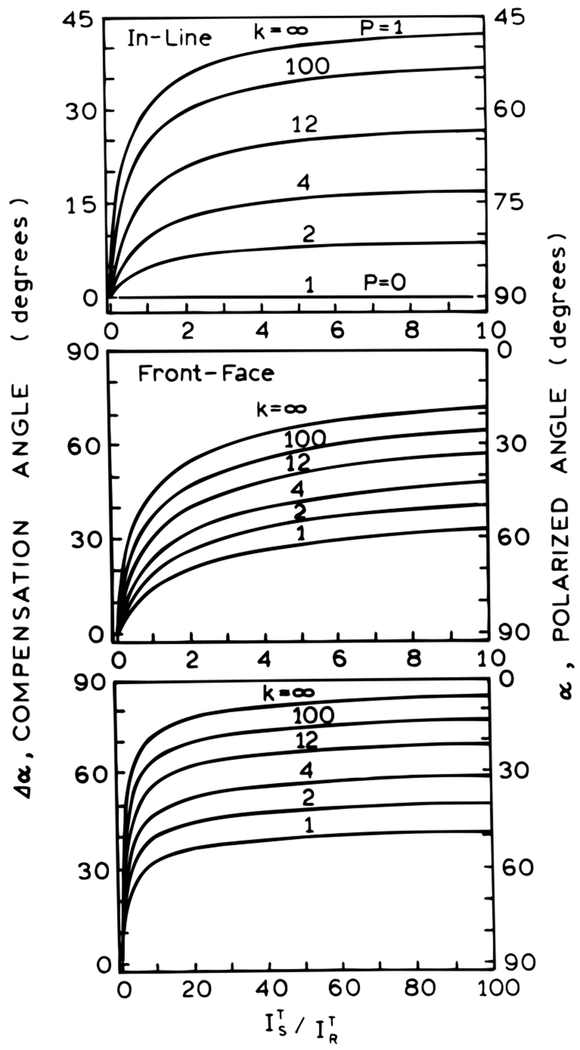
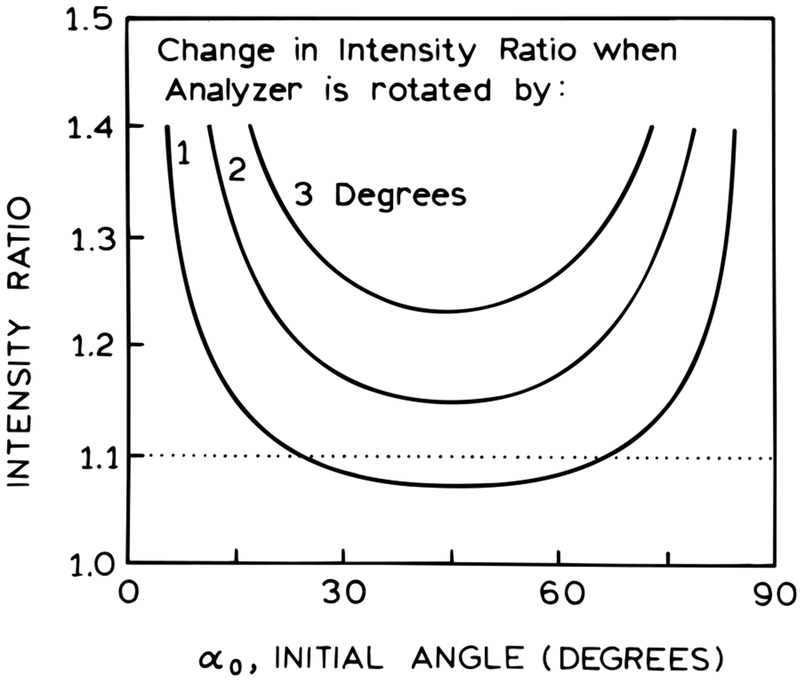
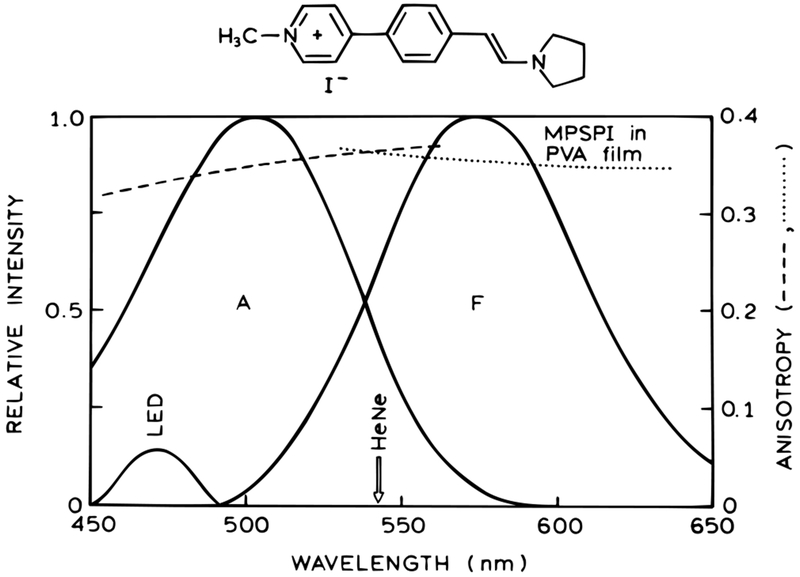
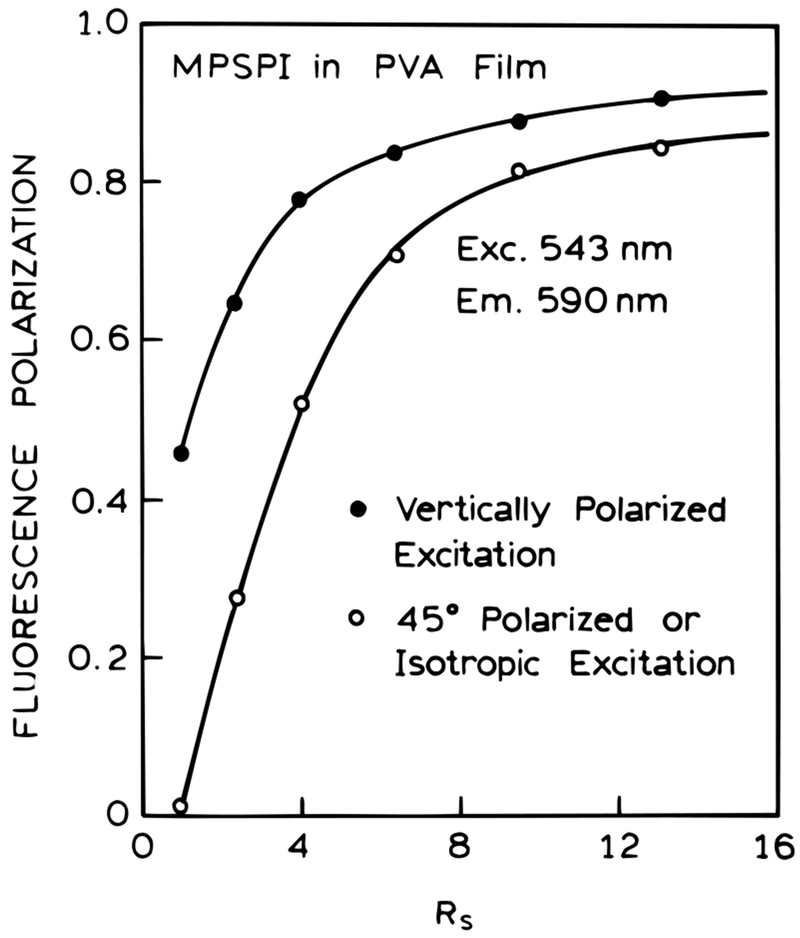
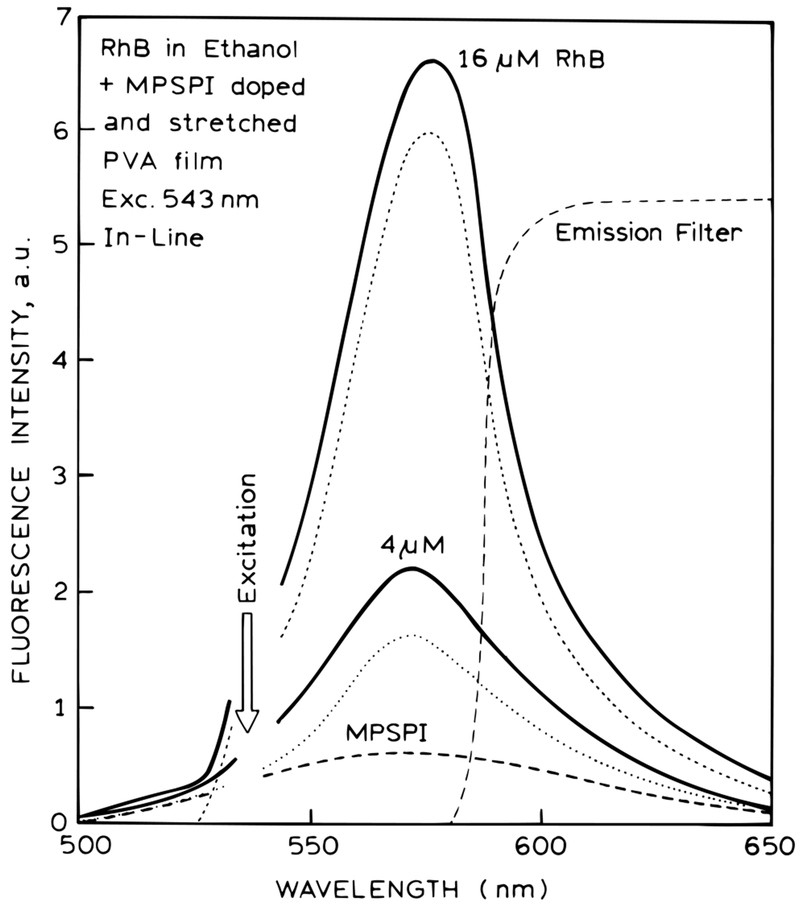
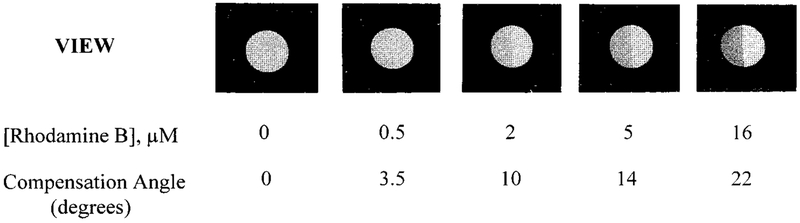
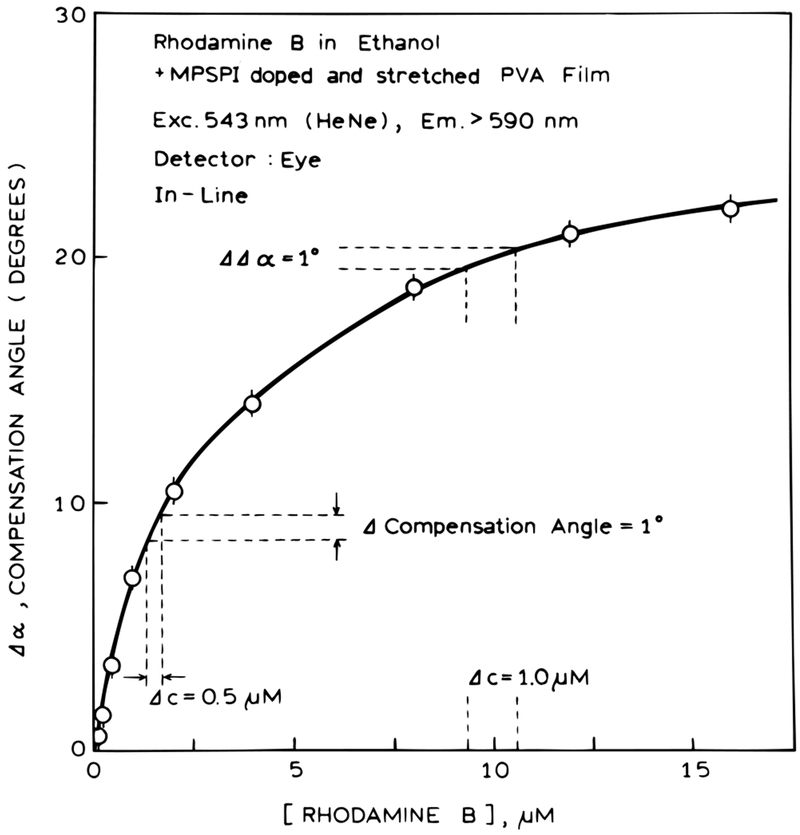
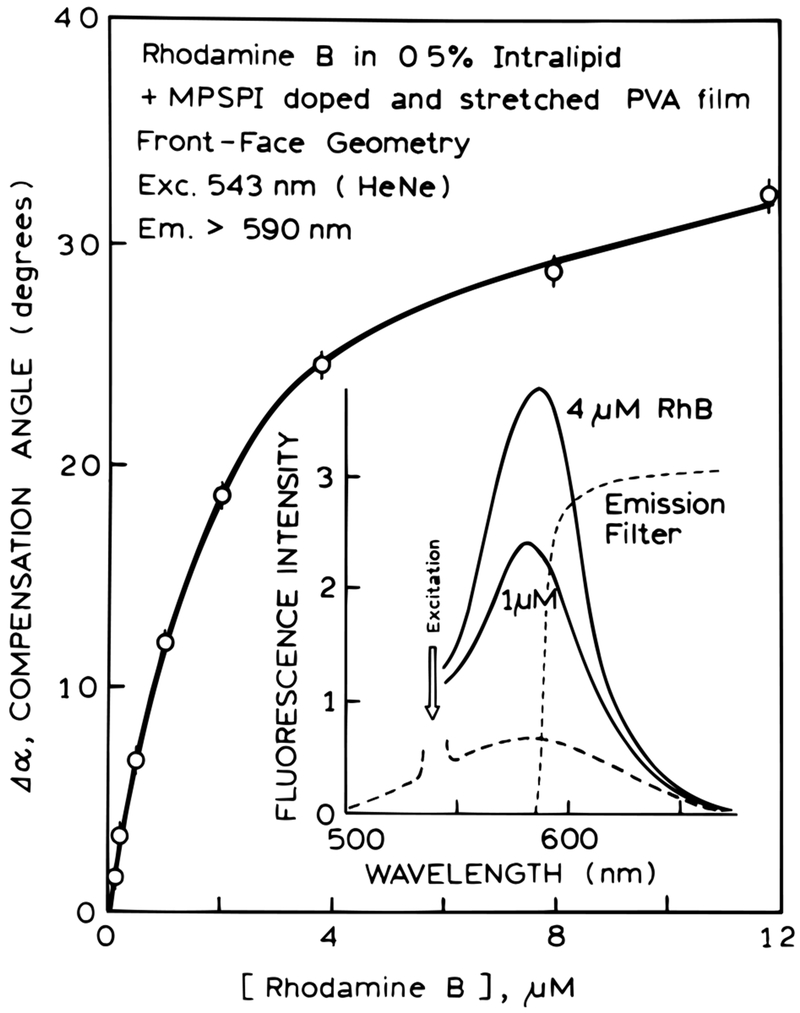
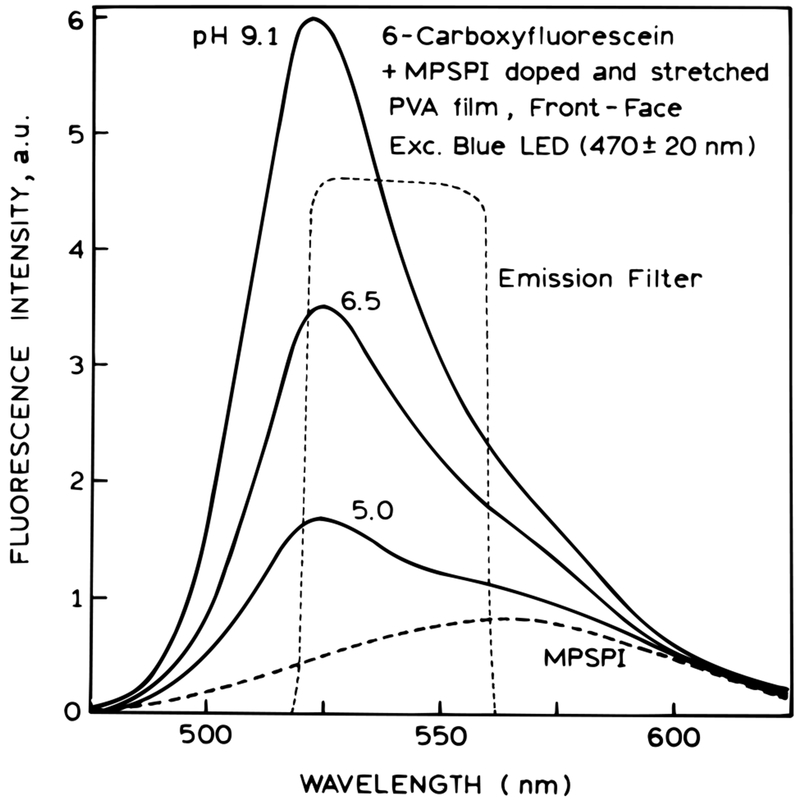
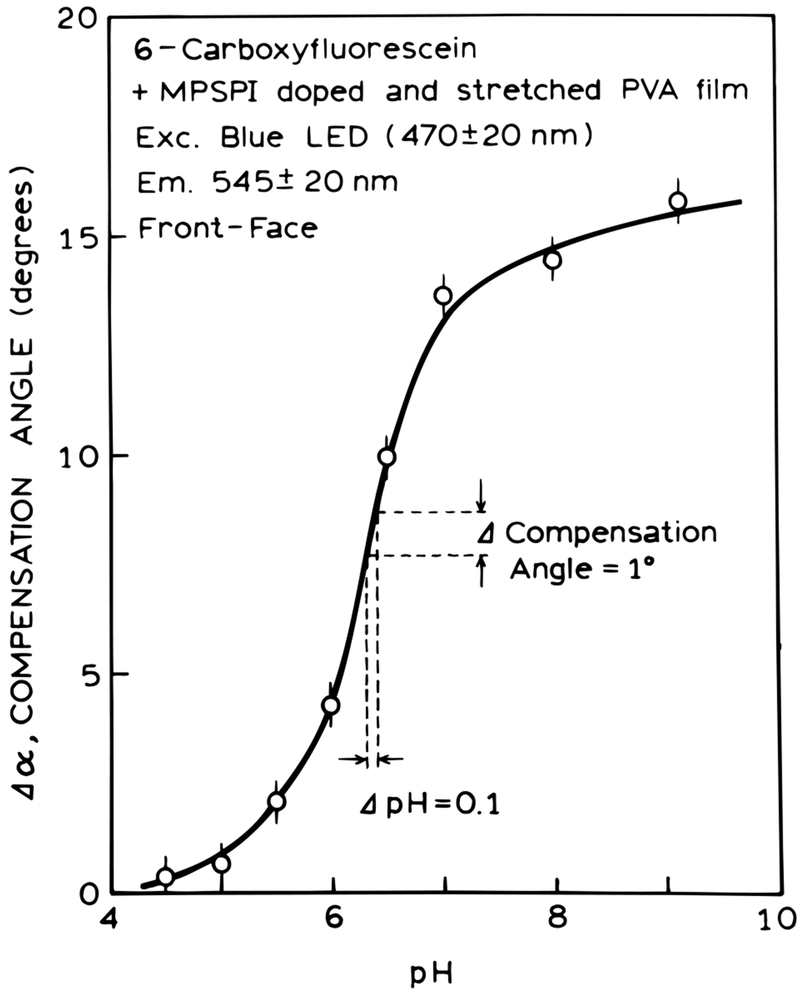
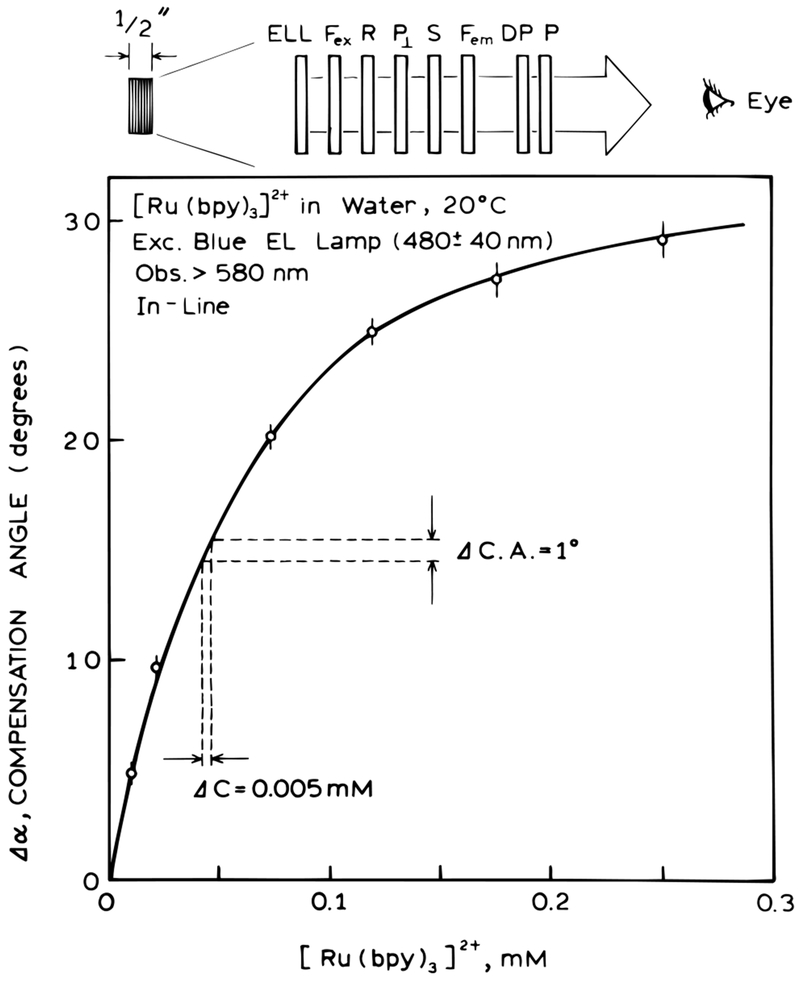
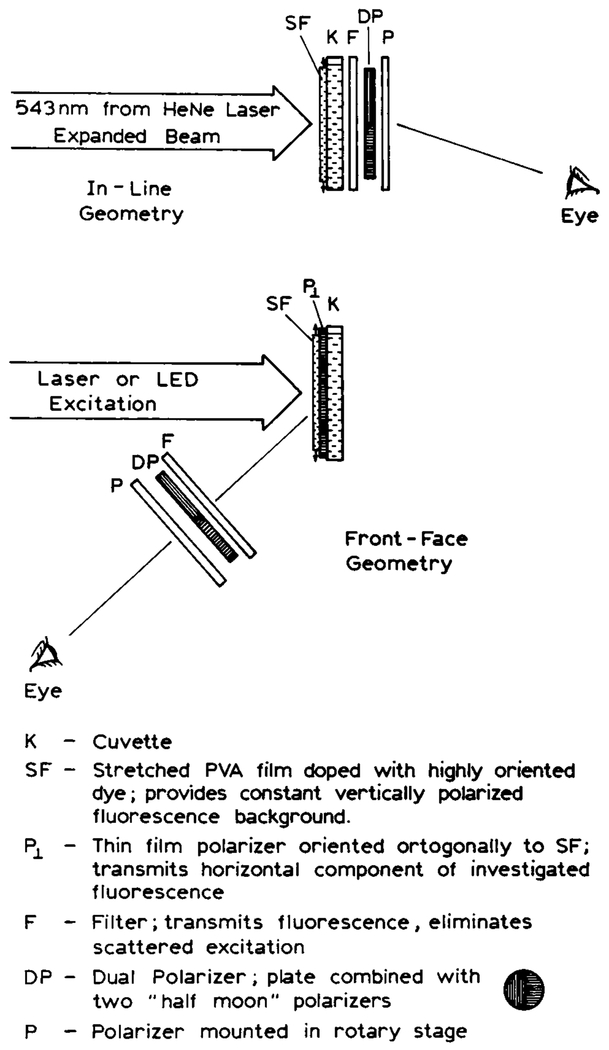
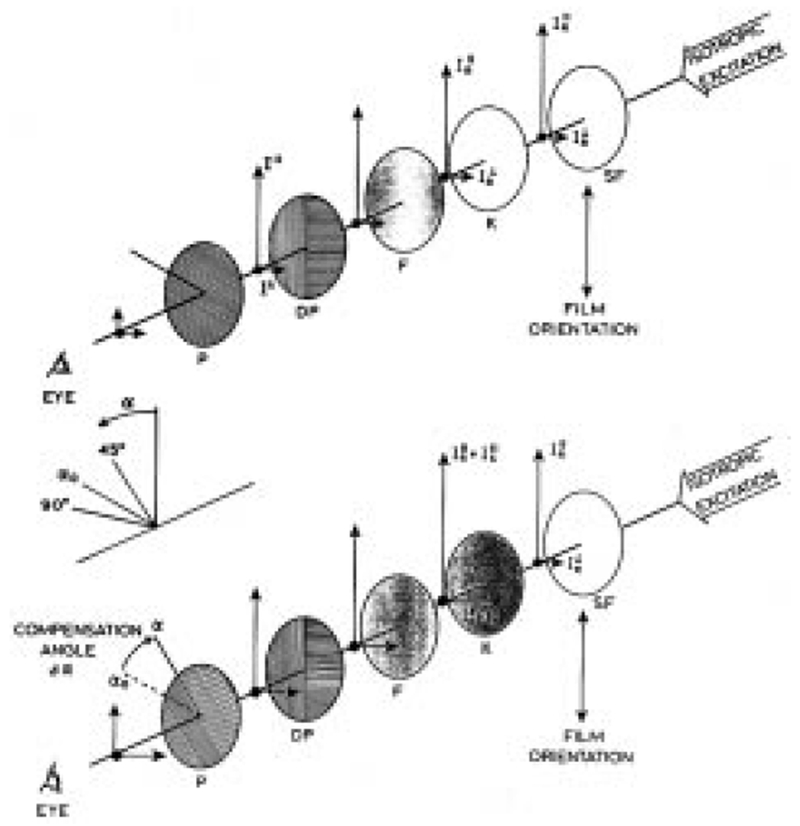
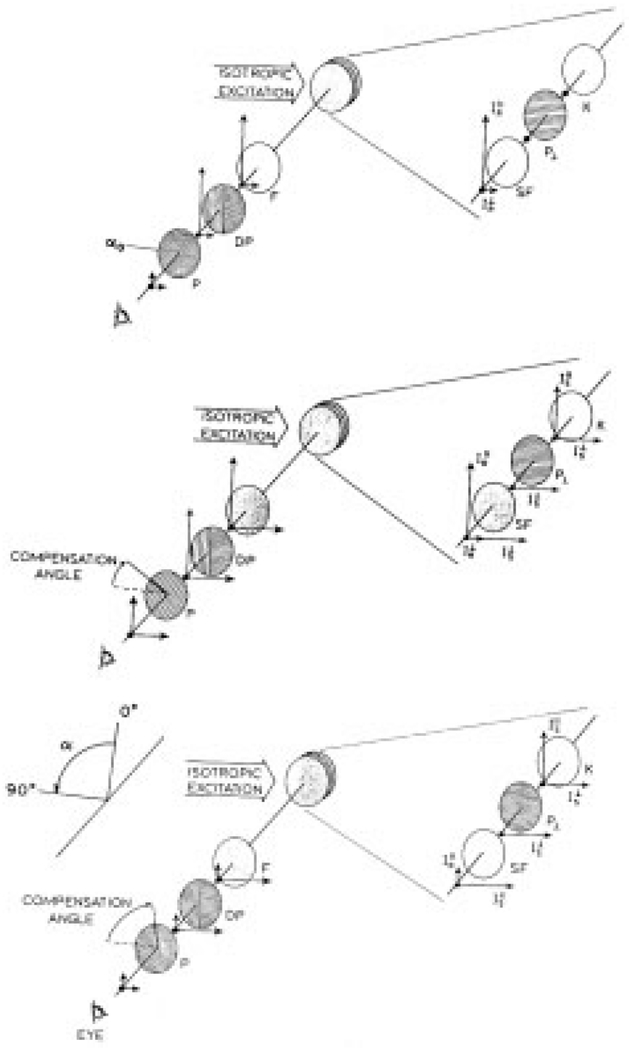
We describe a new approach to fluorescence sensing which relies on visual determination the polarization. The sensing device consists of a fluorescent probe, which changes intensity in responses to the analyte, and an oriented fluorescent film, which is not affected by the analyte. An emission filter is selected to observe the emission from both the film and the sensing fluorophore. Changes in the probe intensity result in changes in the polarization of the combined emission from the sensor and reference. The degree of polarization can be detected visually using a dual polarizer with adjacent sections oriented orthogonally to each other. The emission passing through the dual polarizer is viewed with a second analyzing polarizer. This analyzer is rotated manually to yield equal intensities from both sides of the dual polarizer. This approach was used to measure the concentration of RhB in intralipid and to measure pH using 6-carboxyfluorescein. The analyzer angle is typically accurate to 1 degree, providing pH values accurate to +/- 0.1 pH unit at the midpoint of the titration curve. We also describe a method of visual polarization sensing that does not require an oriented film and that can use the same fluorophore for the sample and reference. These approaches to visual sensing are generic and can be applied to a wide variety of analytes for which fluorescent probes are available. Importantly, the devices are simple, with the only electronic component being the light source.


Figures

Figure 1.
Figure 1.
Calculated compensation angles for in-line anisotropy sensing (top) and front-face anisotropy sensing (middle and bottom). The lower two panels are similar, except for the scale of the x axis.
Figure 2.
Figure 2.
Dependence of the intensity ratio for change in α of 1, 2, or 3°. The x axis is the starting angle α0. The intensity ratio was plotted as a value greater than unity.
Figure 3.
Figure 3.
Absorption and emission spectra of the reference fluorophore MPSPI in an unoriented poly(vinyl alcohol) film. Also shown are the excitation and emission anisotropy spectra in the PVA film. The excitation wavelengths available from the LED and HeNe laser are indicated on the xaxis.
Figure 4.
Figure 4.
Fluorescence polarization of MPSPI in the PVA film as a function of the stretching ratio. The stretching ratio RS is related to the actual physical fold of the stretch N by RS = N3/2 [29].
Figure 5.
Figure 5.
Emission spectra of rhodamine B in ethanol with (—) and without (•••) with the MPSPI reference. The dashed line (---) shows the emission spectrum of MPSPI alone. The additional dotted line shows transmission profile of the emission filter.
Figure 6.
Figure 6.
Emitted light observed through the analyzer polarizer (P) for different concentrations of rhodamine B using the MPSPI reference and the in-line geometry. The position of the analyzer polarizer is at α0 near 75° for all images. The listed values are the compensation angles (Δα) needed to equalize the intensities.
Figure 7.
Figure 7.
Dependence of the compensation angle (Δα) on the concentration of rhodamine B using the in-line geometry (Chart 2, top). The uncertainty in the compensation angle is shown as ΔΔα.
Figure 8.
Figure 8.
Dependence of the compensation angle on the rhodamine B concentration in 0.5% intralipid. These data were obtained using the front-face geometry (Chart 2, lower panel). The inset shows the emission spectra observed for the rhodamine B–MPSPI sample. The dashed line emission spectrum is of the MPSPI reference alone.
Figure 9.
Figure 9.
Emission spectra of a front-face anisotropy pH sensor based on 6-carboxyfluorescein. The dashed line shows the transmission profile of the emission filter used for the visual measurements.
Figure 10.
Figure 10.
Compensation angles for the front-face polarization pH sensor.
Figure 11.
Figure 11.
Visual detection of the concentration of [Ru(bpy)3]2+ measured using the same compound as the reference: ELL, electroluminescent light source; Fex, excitation filter; R, reference solution with a constant concentration of [Ru(bpy)3]2+, P, polarizer; S, sample with varying concentrations of [Ru(bpy)3]2+, Fem, emission filter; DP, dual polarizer; P, analyzer polarizer.
Chart 1.
Chart 1.. Anisotropy-Based Sensing for Blood Chemistry and Transdermal Measurementsa
a (top) The excitation source, sample, and detector in an inline geometry. (bottom) The fluorescence from the implanted patch and/or tissue is observed using front-face geometry.
Chart 2.
Chart 2.. Optical System for Anisotropy-Based Sensing with Visual Detectiona
a (top) In-line geometry with the stretched film. (bottom) Front-face geometry. In the front-face geometry with the stretched film, it is possible to use an additional polarizer P which allows selective detection of the horizontal component of the fluorescence from the sample cuvette K. Such a configuration extends the range of angles (angles needed to equalize the transmittance of both polarizers in DP) to 90°. Front-face anisotropy sensing can be performed without the additional polarizer, resulting in the 45° range of angles. It does not seem practical to use the polarizer P in the in-line geometry when using an oriented film as the reference.
Chart 3.
Chart 3.. Polarizer Angles for In-Line Anisotropy Sensinga
a In the top panel there is no emission from the sample. For a strongly oriented reference, the initial polarizer angle is near 90° from the vertical. In the lower panel, the sample emission is dominant, and the angle is near 45° from the vertical.
Chart 4.
Chart 4.. Polarizer Angles for Front-Face Anisotropy Sensinga
a In the top panel, there is no emission from the sample. For a strongly oriented reference film, the initial polarizer angle is near 90° from the vertical. In the bottom panel, the sample emission is dominant, and the angle approaches 0° from the vertical.

Similar articles

Cited by

References

    1. Spichiger-Keller UE Chemical Sensors and Biosensors for Medical and Biological Applications; Wiley-VCH: New York, 1998; p 413.
    1. Kunz RE, Ed. Sens. Aduators B 1997, B38, 1–188; 1997, B39, 1–468 (Proc. of 3rd European Conference on Optical Chemical Sensors and Biosensors, Europt(R)odeIII).
    1. Thompson RB, Ed. SPIE Proc. 1997. , 2980, 582.
    1. Lakowicz JR, Ed. Topics in Fluorescence Spectroscopy, Volume 4: Probe Design and Chemical Sensing; Plenum Press: New York, 1994; p 501.
    1. Schulman SG, Ed. Molecular Luminescence Spectroscopy, Methods and Applications: Part 3; John Wiley & Sons: New York, 1993; p 467.

Publication types