. 1999 May;19(5):3278-88.
doi: 10.1128/MCB.19.5.3278.

Insulin receptor isoform A, a newly recognized, high-affinity insulin-like growth factor II receptor in fetal and cancer cells

Affiliations

Insulin receptor isoform A, a newly recognized, high-affinity insulin-like growth factor II receptor in fetal and cancer cells

F Frasca et al. Mol Cell Biol. 1999 May.

Abstract

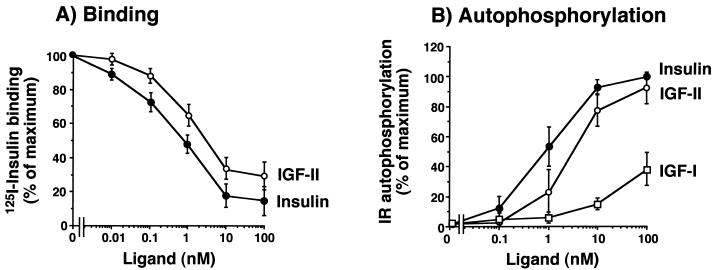
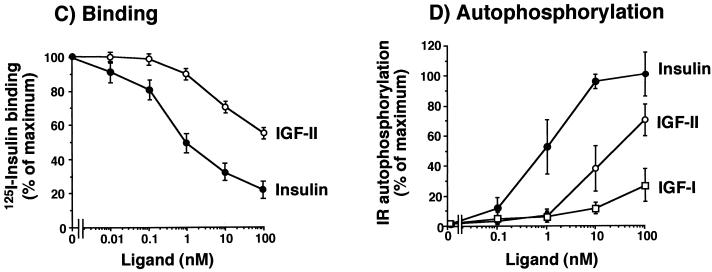
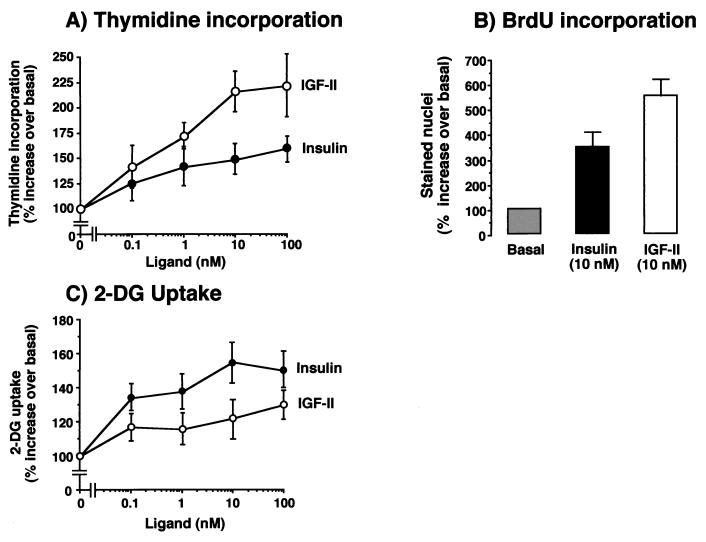
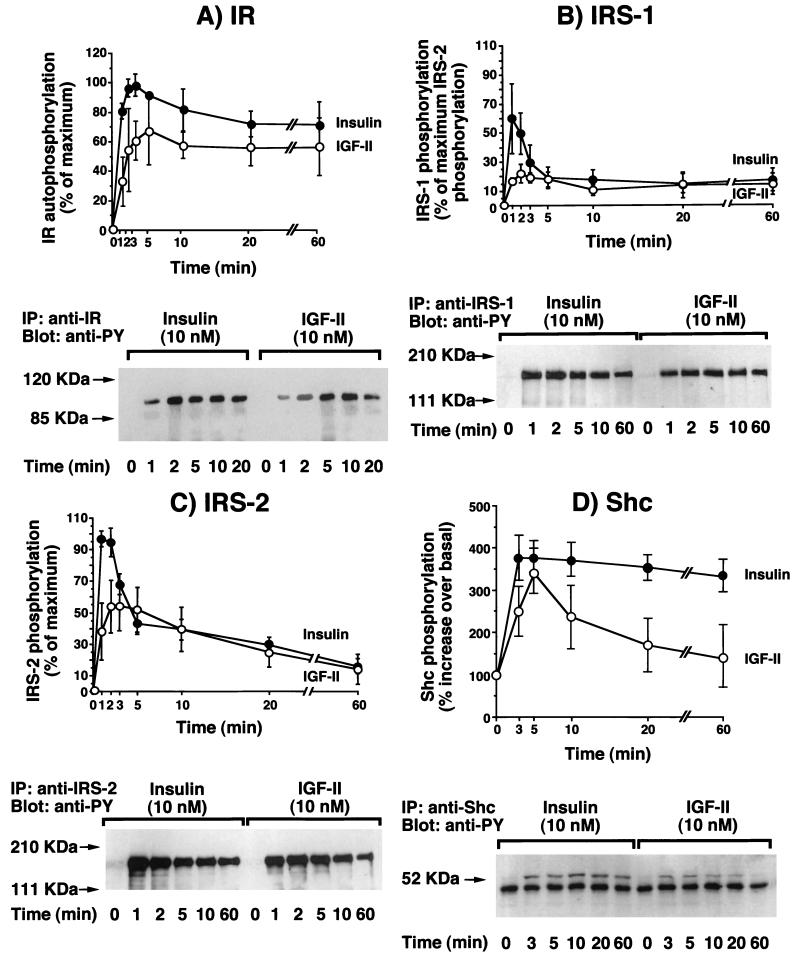
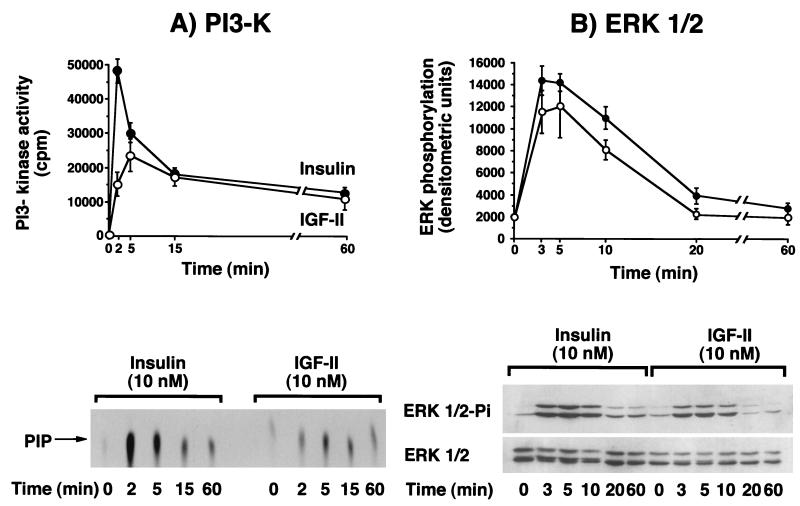
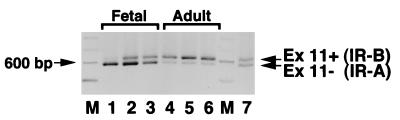
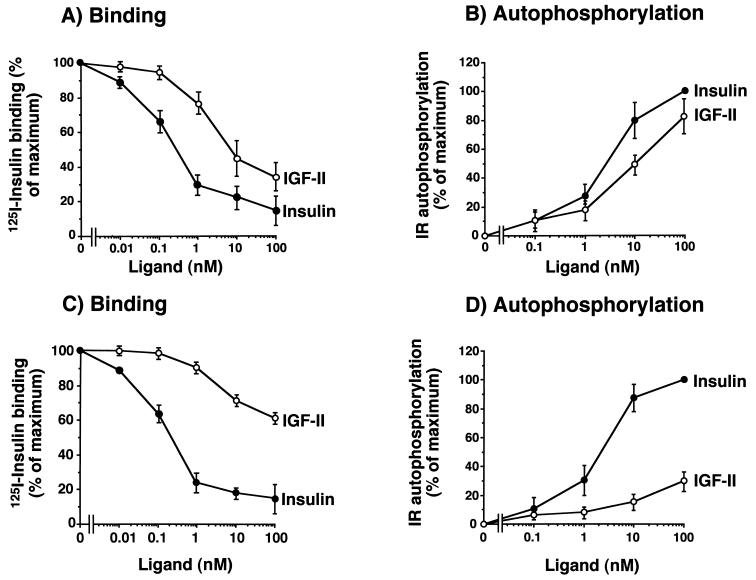
Insulin-like growth factor II (IGF-II) is a peptide growth factor that is homologous to both insulin-like growth factor I (IGF-I) and insulin and plays an important role in embryonic development and carcinogenesis. IGF-II is believed to mediate its cellular signaling via the transmembrane tyrosine kinase type 1 insulin-like growth factor receptor (IGF-I-R), which is also the receptor for IGF-I. Earlier studies with both cultured cells and transgenic mice, however, have suggested that in the embryo the insulin receptor (IR) may also be a receptor for IGF-II. In most cells and tissues, IR binds IGF-II with relatively low affinity. The IR is expressed in two isoforms (IR-A and IR-B) differing by 12 amino acids due to the alternative splicing of exon 11. In the present study we found that IR-A but not IR-B bound IGF-II with an affinity close to that of insulin. Moreover, IGF-II bound to IR-A with an affinity equal to that of IGF-II binding to the IGF-I-R. Activation of IR-A by insulin led primarily to metabolic effects, whereas activation of IR-A by IGF-II led primarily to mitogenic effects. These differences in the biological effects of IR-A when activated by either IGF-II or insulin were associated with differential recruitment and activation of intracellular substrates. IR-A was preferentially expressed in fetal cells such as fetal fibroblasts, muscle, liver and kidney and had a relatively increased proportion of isoform A. IR-A expression was also increased in several tumors including those of the breast and colon. These data indicate, therefore, that there are two receptors for IGF-II, both IGF-I-R and IR-A. Further, they suggest that interaction of IGF-II with IR-A may play a role both in fetal growth and cancer biology.


Figures

FIG. 1
FIG. 1
IGF-II binds to and activates the IR-A (A and B) with a higher affinity than IR-B (C and D) in mouse R cells stably transfected with either isoform human cDNA. (A and C) Binding studies. Cells were grown to approximately 80% of confluence and, after 16 h of starvation in serum-free medium, were incubated with 125I-insulin (10.0 pM) for a further 16 h at 4°C in the presence of increasing concentrations of either insulin or IGF-II. Then cell-associated radioactivity was measured in a γ-counter. The data represent the mean and standard error (SE) of six separate experiments. (B and D) IR autophosphorylation. Confluent cells were serum starved for 48 h in serum-free medium, exposed to either insulin or IGF-II at the indicated concentrations for 5 min, and solubilized in ice-cold lysis buffer. IR autophosphorylation was measured by an ELISA (3, 4) with a specific anti-IR antibody (MA-20) to immunocapture the IRs, and an antiphosphotyrosine biotin-conjugated antibody with streptavidin to phosphorylated tyrosines. The data represent the mean and standard error of six separate experiments.
FIG. 1
FIG. 1
IGF-II binds to and activates the IR-A (A and B) with a higher affinity than IR-B (C and D) in mouse R cells stably transfected with either isoform human cDNA. (A and C) Binding studies. Cells were grown to approximately 80% of confluence and, after 16 h of starvation in serum-free medium, were incubated with 125I-insulin (10.0 pM) for a further 16 h at 4°C in the presence of increasing concentrations of either insulin or IGF-II. Then cell-associated radioactivity was measured in a γ-counter. The data represent the mean and standard error (SE) of six separate experiments. (B and D) IR autophosphorylation. Confluent cells were serum starved for 48 h in serum-free medium, exposed to either insulin or IGF-II at the indicated concentrations for 5 min, and solubilized in ice-cold lysis buffer. IR autophosphorylation was measured by an ELISA (3, 4) with a specific anti-IR antibody (MA-20) to immunocapture the IRs, and an antiphosphotyrosine biotin-conjugated antibody with streptavidin to phosphorylated tyrosines. The data represent the mean and standard error of six separate experiments.
FIG. 2
FIG. 2
Mitogenic and metabolic effects of IR-A activated by either insulin or IGF-II. Mouse R cells, stably transfected with the IR-A cDNA (R/IR-A), were exposed to either insulin or IGF-II. (A) [3H]thymidine incorporation. Cells grown in 24-multiwell plates were serum starved for 48 h in serum-free medium and then exposed to either insulin or IGF-II for a further 48 h at the indicated concentrations. At the end of the stimulation, [3H]thymidine (0.5 μCi/well) was added for 2 h at 37°C. After cell solubilization, incorporation of [3H]thymidine into nuclei, an index of cell proliferation, was measured in the acid-insoluble fraction in a scintillation counter. Data represent the mean and standard error of five separate experiments. (B) Bromodeoxyuridine incorporation. Parallel experiments were carried out by measuring the percentage of 5-bromodeoxyuridine (BrdU) labeled nuclei of cells exposed to 10 nM insulin or IGF-II. Data represent the mean and standard error of five separate experiments. (C) 2-Deoxyglucose transport. Cells grown in 24-multiwell plates were incubated in 5.5 mM glucose for 48 h, and then either insulin or IGF-II was added for 90 min at the indicated concentrations. 2-Deoxyglucose (2-DG) (0.1 mM; 0.2 μCi/ml) was added, and cells were incubated on ice for 10 min. After cell solubilization, 2-deoxyglucose uptake, an index of the metabolic effect, was measured in a scintillation counter. Data represent the mean and standard error of five separate experiments.
FIG. 3
FIG. 3
Time courses of IR-A phosphorylation and post-receptor protein phosphorylation of IRS-1, IRS-2, and Shc in mouse R cells transfected with IR-A cDNA and exposed to either insulin or IGF-II. Confluent cells were serum starved for 48 h in serum-free medium, exposed to 10 nM either insulin or IGF-II for the indicated times, and solubilized in lysis buffer. After protein quantitation, aliquots were used for ELISA and Western blot measurements. (A) IR autophosphorylation was quantitated by a specific ELISA (top) and detected by Western blotting (bottom). Monoclonal antibody MA-20 was used to immunocapture phosphorylated IR. (B) IRS-1 phosphorylation was measured by a specific ELISA (top) and detected by Western blotting (bottom). A polyclonal anti-IRS-1 antibody was used to immunocapture phosphorylated IRS-1. (C) IRS-2 phosphorylation was quantitated by a specific ELISA (top) and detected by Western blotting (bottom). A polyclonal anti-IRS-2 antibody was used to immunocapture phosphorylated IRS-2. (D) The 52-kDa Shc isoform phosphorylation was detected by Western blotting (bottom) and quantitated by densitometric scanning with Adobe Photoshop and NIH Image software (top). A polyclonal anti-Shc antibody was used to immunocapture phosphorylated Shc. Tyrosine phosphorylation of these proteins was revealed by using an antiphosphotyrosine (anti-PY) antibody biotin conjugated for the ELISAs. The top panels show the mean and standard error of three separate experiments (except for Shc, where five experiments were carried out); the bottom panels show a representative experiment of three (five for Shc). IP, immunoprecipitation.
FIG. 4
FIG. 4
Time course of either insulin or IGF-II in stimulating PI3-K activity and ERK1 and ERK2 phosphorylation in R cells overexpressing IR-A. Confluent cells were serum starved for 48 h in serum-free medium and then treated with 10 nM insulin or IGF-II for the indicated times. The cells were solubilized in ice-cold lysis buffer, and after protein quantitation, samples were subjected to either immunoprecipitation or Western blotting. (A) PI3-kinase activity was evaluated in antiphosphotyrosine immunoprecipitates by measuring 33P incorporation into PI, as indicated in Materials and Methods. The reaction mixture was spotted onto a silica gel plate and subjected to radioactivity counting of PIP spots (top) (mean and standard error of three separate experiments) and autoradiography (bottom). (B) ERK1 and ERK2 phosphorylation was studied by Western blotting with an anti-phosphorylated ERK-specific antibody, and the filter was reprobed with anti-ERK1 and anti-ERK2 polyclonal antibody (New England Biolabs). The top panel shows densitometric scanning (mean and standard error of four separate experiments), using Adobe Photoshop and NIH Image software; the bottom panel shows a representative experiment.
FIG. 5
FIG. 5
IR isoform expression is different in fetal and adult human fibroblasts, as measured by RT-PCR. RNA was extracted by the acidic-phenol method from cultured fibroblasts obtained from three fetuses and three adult subjects, and RT-PCR of IR isoform expression was carried out for 25 cycles. After electrophoresis in 2% agarose gel, ethidium bromide-stained DNA fragments (600 and 636 bp for IR-A and IR-B, respectively) were quantitated by scanning densitometry with Adobe Photoshop and NIH Image software. Fetal fibroblasts (lanes 1 to 3) predominantly expressed the IR-A isoform, whereas adult fibroblasts (lanes 4 to 6) predominantly expressed the IR-B isoform. A mixture of cDNA (1:1) of the two isoforms was coamplified and used as positive control (lane 7). A representative experiment is shown.
FIG. 6
FIG. 6
IGF-II binds to and activates IR with high affinity in fetal human fibroblasts (A and B) but not in adult human fibroblasts (C and D). (A and C) Binding studies. Fibroblasts from three adult and three fetal subjects were grown to approximately 80% confluence and, after 16 h of starvation in serum-free medium, incubated with 125I-insulin (10.0 pM) for a further 16 h at 4°C in the presence of increasing concentrations of either insulin or IGF-II. Cell-associated radioactivity was then measured in a γ-counter. The results are the mean and standard error of three separate experiments with fibroblasts from different subjects. (B and D) IR autophosphorylation. Confluent fibroblasts were serum starved for 24 h in serum-free medium and then exposed to either insulin or IGF-II at the indicated concentrations for 5 min. After solubilization in ice-cold lysis buffer, IR autophosphorylation was measured by an ELISA with a specific anti-IR antibody (MA-20) to immunocapture the IRs and an antiphosphotyrosine biotin-conjugated antibody with streptavidin to readout phosphorylated tyrosines. The results are the mean and standard error of three separate experiments with fibroblasts from different subjects.

References

    1. Alexandrides T, Moses A C, Smith R J. Developmental expression of receptors for insulin, insulin-like growth factor I (IGF-I), and IGF-II in rat skeletal muscle. Endocrinology. 1989;124:1064–1076. - PubMed
    1. Avruch J. Insulin signal transduction through protein kinase cascades. Mol Cell Biochem. 1998;182:31–48. - PubMed
    1. Belfiore A, Costantino A, Frasca F, Pandini G, Mineo R, Vigneri P, Goldfine I D, Maddux B A, Vigneri R. Overexpression of membrane glycoprotein PC-1 in MDA-MB 231 breast cancer cells is associated with inhibition of insulin receptor tyrosine kinase activity. Mol Endocrinol. 1996;10:1318–1326. - PubMed
    1. Boge A, Roth R A. A non radioactive assay for the insulin receptor tyrosine kinase: use in monitoring receptor tyrosine kinase activity after activation of overexpressed protein kinase C alpha and high glucose treatment. Anal Biochem. 1995;231:323–332. - PubMed
    1. Borsi L, Balza E, Gaggero B, Alemanni G, Zardi L. The alternative splicing pattern of the tenascin-C pre-mRNA is controlled by the extracellular pH. J Biol Chem. 1995;270:6243–6245. - PubMed

Publication types

MeSH terms

Substances

LinkOut - more resources