. 1999 May;19(5):3349-59.
doi: 10.1128/MCB.19.5.3349.

The linking regions of EBNA1 are essential for its support of replication and transcription

Affiliations

The linking regions of EBNA1 are essential for its support of replication and transcription

D Mackey et al. Mol Cell Biol. 1999 May.

Abstract

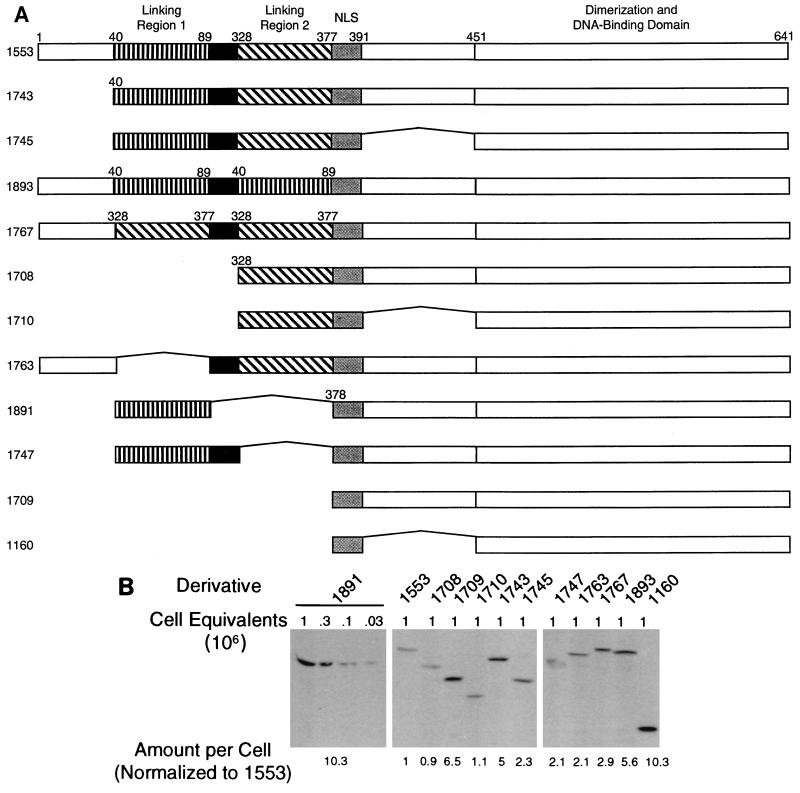
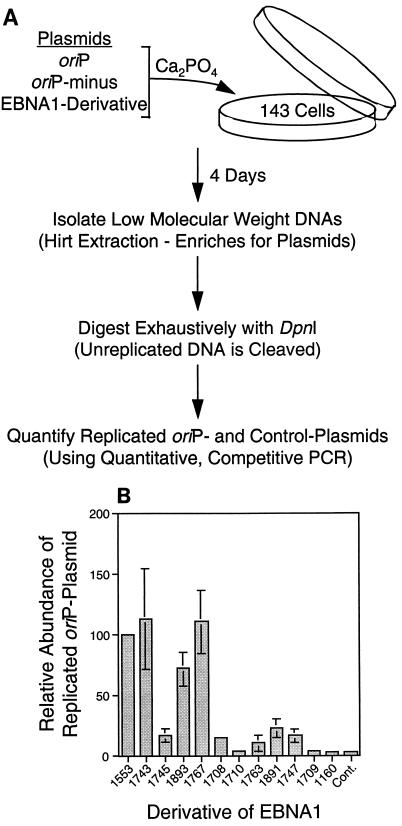
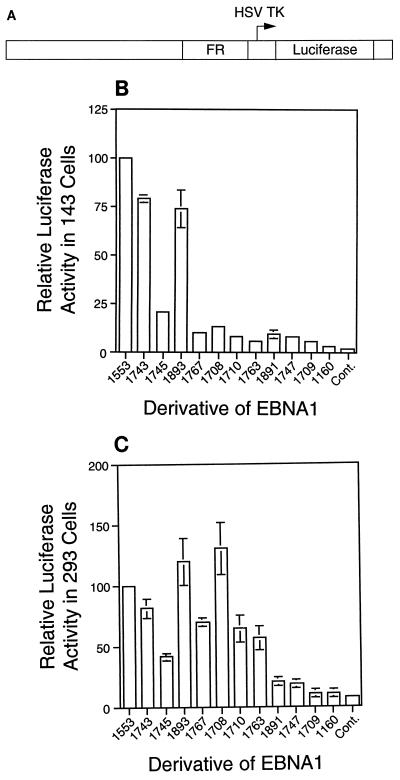
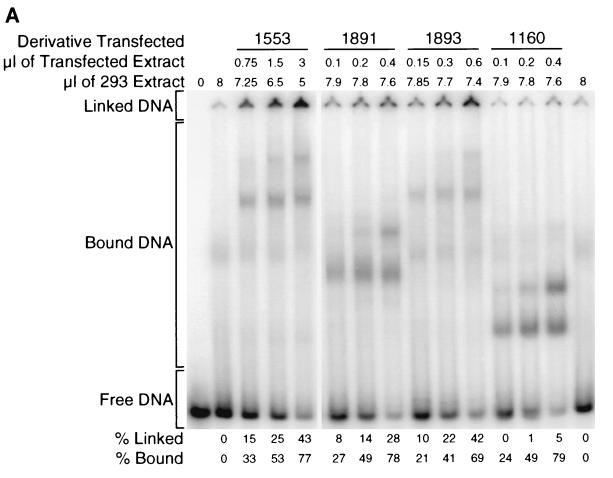
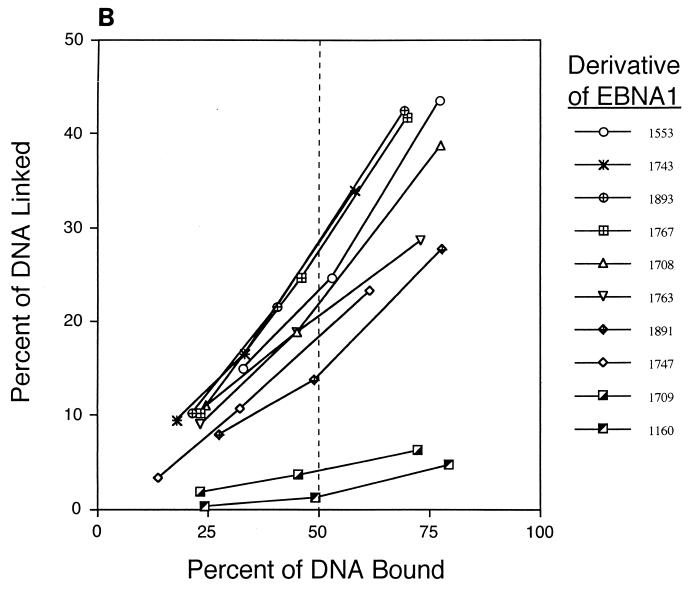
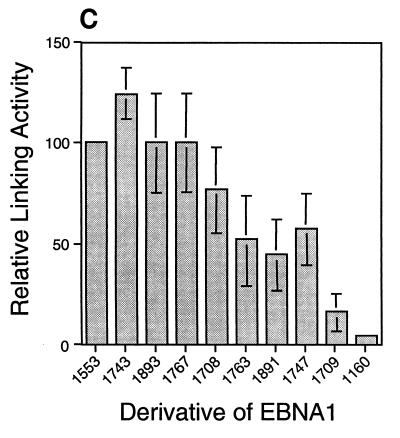
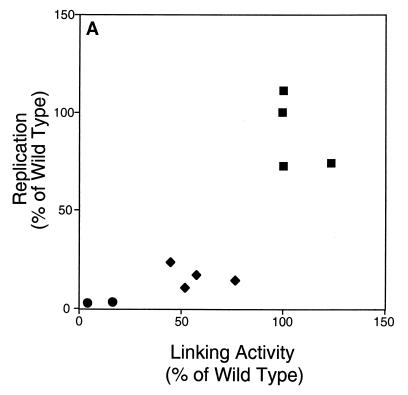
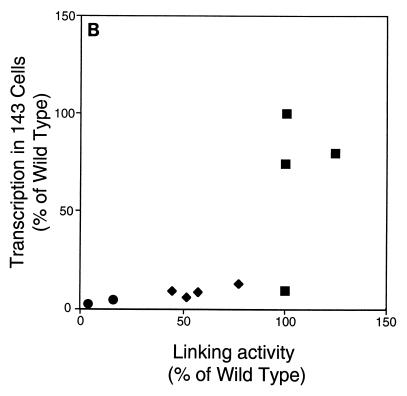
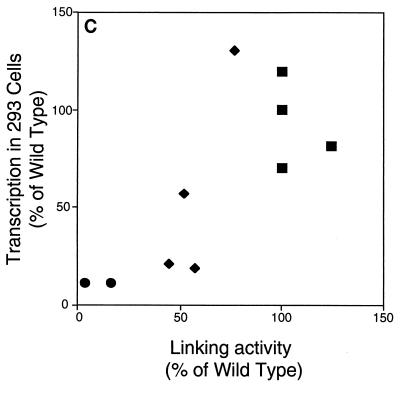
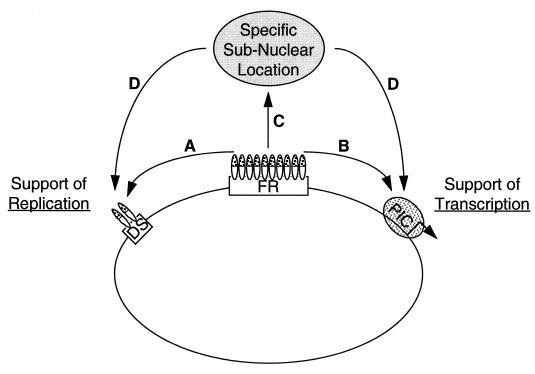
The ability of distant cis-acting DNA elements to interact functionally has been proposed to be mediated by the interaction of proteins associated site specifically with those cis-acting elements. We have found that the DNA-linking regions of EBNA1 are essential for its contribution to both replication and transcription. The synthesis of plasmids containing the Epstein-Barr virus (EBV) origin of plasmid replication (oriP) can be mediated entirely by the cellular machinery; however, the replicated molecules are lost rapidly from proliferating cells. When EBNA1 is provided in trans, plasmids containing oriP (oriP plasmids) are synthesized during repeated S phases, and the newly formed daughter molecules are precisely segregated to the daughter cells. The contribution(s) of EBNA1 to the stable replication of oriP plasmids is therefore likely to be postsynthetic. In latently infected cells, EBNA1 also regulates the expression of multiple EBV promoters located as many as 10 kbp away. EBNA1 supports replication and transcription through binding to oriP; both the ability of EBNA1 to bind to DNA and the integrity of its binding sites in oriP are required. However, DNA binding by EBNA1 is not sufficient to support replication or transcription, indicating that an additional activity (or activities) is required. EBNA1 links DNAs to which it binds and can form a loop between the two subelements of oriP, the family of repeats and the region of dyad symmetry, each of which contains multiple binding sites for EBNA1. We have constructed a set of derivatives of EBNA1 which contain both, one, or neither of its linking regions in various contexts. Analyses of these derivatives demonstrate that the linking regions of EBNA1 are essential for its support of replication and transcription and that the ability of derivatives of EBNA1 to link DNAs correlates strongly with their support of these activities in cells. These findings indicate that protein-protein associations of the linking regions of EBNA1 underlie its long-range contributions to replication and transcription.


Figures

FIG. 1
FIG. 1
Structure and expression of derivatives of EBNA1 studied. (A) Linking region 1 (amino acids 40 to 89) and linking region 2 (amino acids 328 to 377) are regions rich in basic residues; each has been shown to link DNAs. All the derivatives of EBNA1 contain amino acids 451 to 641, which include a domain sufficient for dimerization and site-specific DNA binding. Amino acids 379 to 391 (gray box) contain a nuclear localization sequence (NLS) which is present in all the derivatives. The Gly-Gly-Ala repeats (black box) constitute a domain consisting solely of glycines and alanines. The Gly-Gly-Ala repeats in the derivatives contain only 15 amino acids of the 239 in EBNA1 from the B95-8 strain of EBV. However, the 1553 derivative of EBNA1 supports replication and transcription as well as does full-length EBNA1 and is considered wild type in this study. The amino acid numbers are from EBNA1 of the B95-8 strain. (B) Representative Western blot demonstrating that each derivative is expressed in cells in tissue cultures. Plasmids expressing the derivatives of EBNA1 were introduced into 293 cells as calcium phosphate precipitates. After 48 h, cells were harvested and counted, and the indicated numbers were run on sodium dodecyl sulfate-polyacrylamide gels. Following transfer to nitrocellulose, blots were probed with a rabbit polyclonal antiserum which detects amino acids 451 to 641 of EBNA1. A 35S-labeled secondary antibody (donkey anti-rabbit) was used to detect the bound anti-EBNA1 antibodies. Various numbers of cell equivalents expressing the 1891 derivative were used to generate a standard curve. The relative level of expression of each derivative (with 1553 set to 1) was interpolated from this curve and is shown below the blots. Independent qualitative experiments with an alkaline phosphatase-linked secondary antibody also indicated that the derivatives were expressed similarly (data not shown).
FIG. 2
FIG. 2
Derivatives of EBNA1 support the replication of oriP plasmids to different degrees. (A) Plasmids expressing derivatives of EBNA1 were introduced as calcium phosphate precipitates into 143B cells along with a replication reporter plasmid (containing oriP) and a replication control plasmid (lacking oriP). After 4 days, plasmid DNA was isolated by Hirt extraction, linearized with HindIII, and digested with DpnI, which cleaves input DNAs that have not undergone multiple rounds of DNA synthesis. A quantitative competitive PCR assay was used to measure the amounts of replicated plasmids containing and lacking oriP. (B) Average amount of replicated oriP plasmid measured in transfections with derivatives of EBNA1. The amount of replicated oriP plasmid in cells expressing 1553 was set to 100% for each experiment. The control plasmid (pCDNA3; Cont.) has only the CMV IE promoter and expresses no EBNA1. The amount of replicated plasmid lacking oriP, measured simultaneously for all points, was smaller than the amount of replicated plasmid containing oriP from cells transfected with pCDNA3 (data not shown). Shown are the averages and standard errors from four experiments (six data points for 1743 and 1893, five data points for 1767, and three data points for all other derivatives).
FIG. 3
FIG. 3
Derivatives of EBNA1 support transcription through the FR to different degrees. Plasmids expressing derivatives of EBNA1 or pCDNA3 (Cont.) and FR-TK-Luciferase (A) were introduced as calcium phosphate precipitates into 143B (B) and 293 (C) cells, and luciferase activity was measured 48 h later. A plasmid expressing β-galactosidase (pEQ176) was included with each transfection, and β-galactosidase activity was used to normalize each transfection. In each experiment, the normalized luciferase activity measured in cells expressing 1553 was set to 100%. Shown in panels B and C are the averages and standard errors for each derivative from four separate experiments in each cell type. HSV TK, herpes simplex virus thymidine kinase.
FIG. 4
FIG. 4
Derivatives of EBNA1 differ in linking activity measured in a gel shift assay. (A) Extracts of 293 cells expressing various derivatives of EBNA1 were incubated with a radiolabeled, 131-bp DNA containing two EBNA1-binding sites. When a derivative of EBNA1 only binds to this DNA (as with 1160), its mobility is reduced, but the protein-DNA complex still enters the gel. When a derivative of EBNA1 binds to and links this DNA (as with 1553), the linked complex does not migrate appreciably into the gel. The amounts of extracts expressing the derivatives of EBNA1 were varied so that the range of bound DNA spanned 50%. The total amount of 293 cell extract derived from transfected plus untransfected cells in each reaction was constant (8 μl). PhosphorImager analysis was used to quantify the amounts of DNA in the linked, bound, and free regions of each lane. The values for linked and bound DNAs in the lanes containing only 293 cell extract were set to zero. The percentage of linked DNA was determined by dividing the amount of linked DNA by the amount of total DNA in the lane. The percentage of bound DNA was determined by dividing the amounts of linked and bound DNAs by the amount of total DNA in the lane. (B) Graphic representation of all data from the experiment shown partially in panel A. The percentage of linked DNA versus that bound was plotted for the derivatives. This plot was used to determine the percentage of DNA linked when 50% of the DNA was bound. This value was defined as the linking activity for the derivative. (C) Graphic representation of the relative linking activities of derivatives of EBNA1. In each experiment, the linking activity of 1553 was set to 100%. Shown are the averages and standard errors from three separate experiments like the one shown in panel B.
FIG. 4
FIG. 4
Derivatives of EBNA1 differ in linking activity measured in a gel shift assay. (A) Extracts of 293 cells expressing various derivatives of EBNA1 were incubated with a radiolabeled, 131-bp DNA containing two EBNA1-binding sites. When a derivative of EBNA1 only binds to this DNA (as with 1160), its mobility is reduced, but the protein-DNA complex still enters the gel. When a derivative of EBNA1 binds to and links this DNA (as with 1553), the linked complex does not migrate appreciably into the gel. The amounts of extracts expressing the derivatives of EBNA1 were varied so that the range of bound DNA spanned 50%. The total amount of 293 cell extract derived from transfected plus untransfected cells in each reaction was constant (8 μl). PhosphorImager analysis was used to quantify the amounts of DNA in the linked, bound, and free regions of each lane. The values for linked and bound DNAs in the lanes containing only 293 cell extract were set to zero. The percentage of linked DNA was determined by dividing the amount of linked DNA by the amount of total DNA in the lane. The percentage of bound DNA was determined by dividing the amounts of linked and bound DNAs by the amount of total DNA in the lane. (B) Graphic representation of all data from the experiment shown partially in panel A. The percentage of linked DNA versus that bound was plotted for the derivatives. This plot was used to determine the percentage of DNA linked when 50% of the DNA was bound. This value was defined as the linking activity for the derivative. (C) Graphic representation of the relative linking activities of derivatives of EBNA1. In each experiment, the linking activity of 1553 was set to 100%. Shown are the averages and standard errors from three separate experiments like the one shown in panel B.
FIG. 5
FIG. 5
Linking activity and support of replication and transcription correlate for derivatives of EBNA1. The linking activity of derivatives of EBNA1 is plotted against the ability of those derivatives to support replication (A) or transcription in 143B (B) and 293 (C) cells. Squares represent derivatives of EBNA1 with two linking regions, diamonds represent those with one linking region, and circles represent those with neither linking region. Application of the Kendall rank correlation test indicates that for this set of derivatives, linking activity correlates with the activation of replication (P, 0.003) and with the activation of transcription in 143B (P, 0.003) and 293 (P, 0.02) cells.
FIG. 5
FIG. 5
Linking activity and support of replication and transcription correlate for derivatives of EBNA1. The linking activity of derivatives of EBNA1 is plotted against the ability of those derivatives to support replication (A) or transcription in 143B (B) and 293 (C) cells. Squares represent derivatives of EBNA1 with two linking regions, diamonds represent those with one linking region, and circles represent those with neither linking region. Application of the Kendall rank correlation test indicates that for this set of derivatives, linking activity correlates with the activation of replication (P, 0.003) and with the activation of transcription in 143B (P, 0.003) and 293 (P, 0.02) cells.
FIG. 6
FIG. 6
Model of modes by which the linking regions may contribute to the support of replication and transcription by EBNA1. The large circle represents a plasmid containing oriP and a promoter (arrow). The FR and the DS of oriP are bound by EBNA1 (small ovals), with the DNA-binding domain in white and the linking domains mottled. (A) EBNA1-mediated linking of the FR and the DS is likely to contribute to sustained replication of oriP. (B) The linking domains of EBNA1 may interact with basal transcription factors within the PIC, possibly stabilizing PIC binding at the promoter. (C) The linking domains of EBNA1 may interact with specific nuclear factors, targeting EBNA1 and DNAs bound by it to a specific subnuclear location. Linking may also occur between EBNA1 molecules bound to a plasmid and to cellular DNA, thereby localizing the plasmid to a particular chromatin domain. (D) Once localized to a specific site within the nucleus, origins of replication or promoters may more efficiently interact with cellular trans-acting factors.

References

    1. Adams A. Replication of latent Epstein-Barr virus genomes in Raji cells. J Virol. 1987;61:1743–1746. - PMC - PubMed
    1. Aiyar A, Sugden B. Fusions between EBNA-1 of EBV and the large T-antigen of SV40 replicate their cognate origins. J Biol Chem. 1998;273:33073–33081. - PubMed
    1. Aiyar A, Tyree C, Sugden B. The Plasmid replicon of EBV consists of multiple elements that facilitate DNA synthesis by the cell and a viral maintenance element. EMBO J. 1998;17:6394–6403. - PMC - PubMed
    1. Aladjem M I, Groudine M, Brody L L, Dieken E S, Fournier R E, Wahl G M, Epner E M. Participation of the human beta-globin locus control region in initiation of DNA replication. Science. 1995;270:815–819. - PubMed
    1. Ambinder R F, Mullen M, Chang Y-N, Hayward G S, Hayward S D. Functional domains of Epstein-Barr virus nuclear antigen EBNA-1. J Virol. 1991;65:1466–1478. - PMC - PubMed

Publication types

LinkOut - more resources