. 1999 May;19(5):3760-8.
doi: 10.1128/MCB.19.5.3760.

ADD1/SREBP-1c is required in the activation of hepatic lipogenic gene expression by glucose

Affiliations

ADD1/SREBP-1c is required in the activation of hepatic lipogenic gene expression by glucose

M Foretz et al. Mol Cell Biol. 1999 May.

Abstract

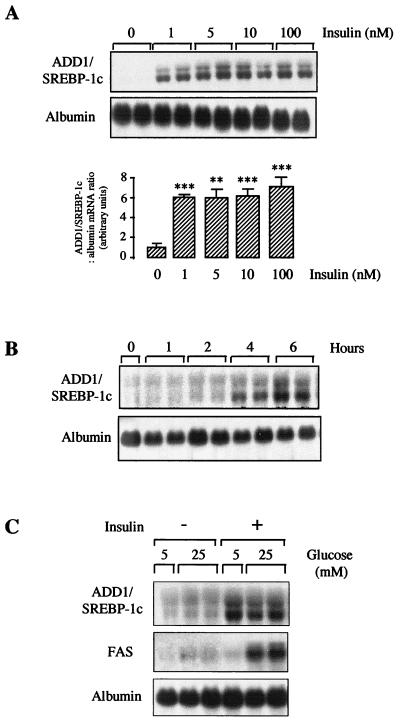
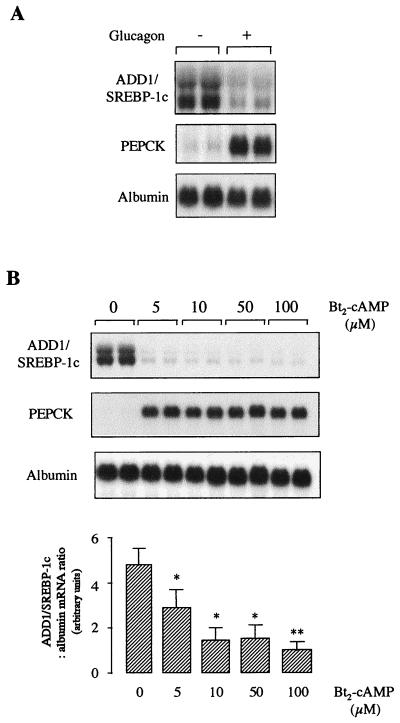
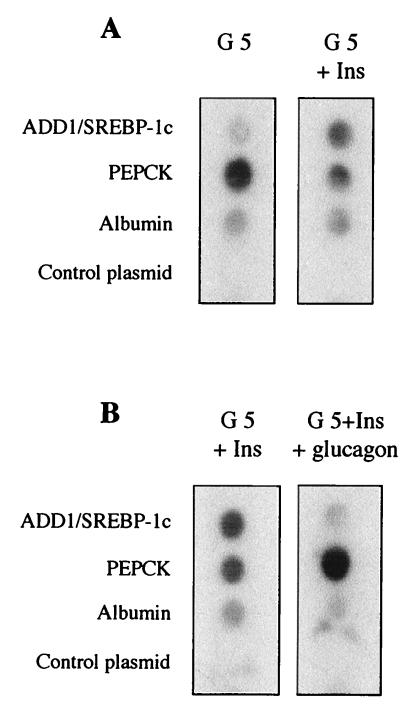
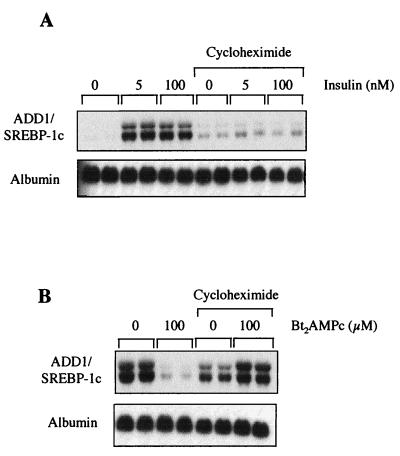
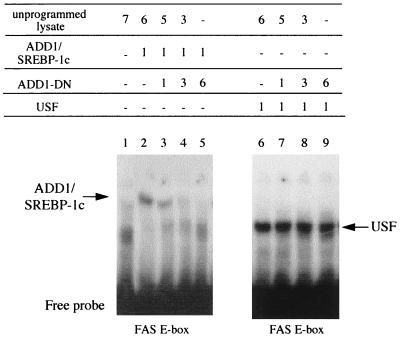
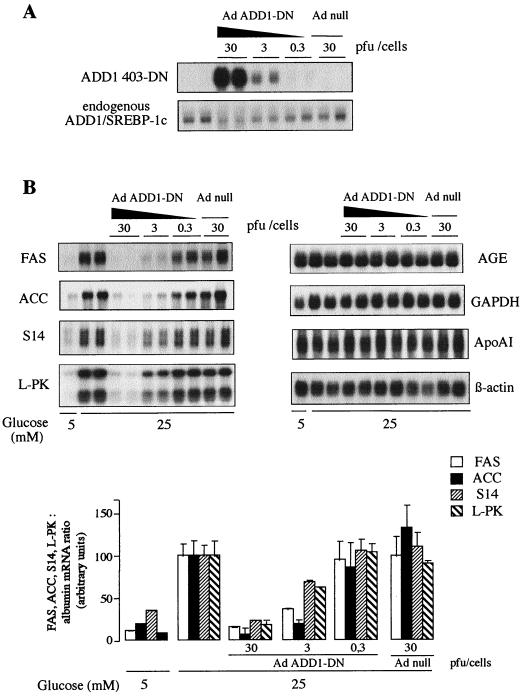
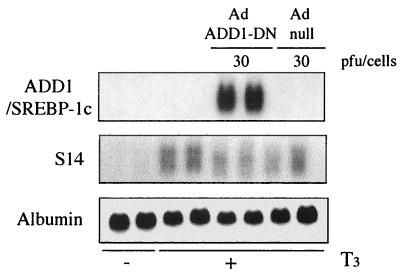
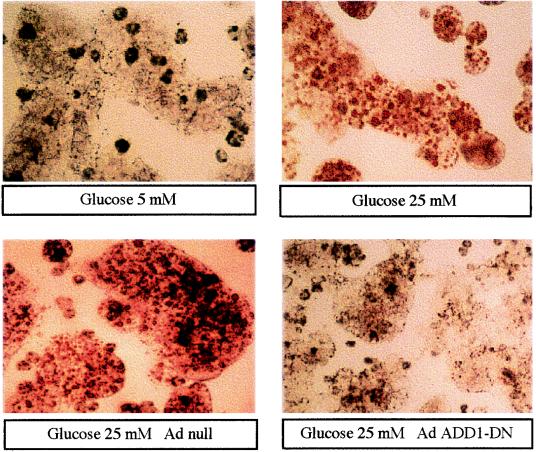
The transcription of genes encoding proteins involved in the hepatic synthesis of lipids from glucose is strongly stimulated by carbohydrate feeding. It is now well established that in the liver, glucose is the main activator of the expression of this group of genes, with insulin having only a permissive role. While ADD1/SREBP-1 has been implicated in lipogenic gene expression through temporal association with food intake and ectopic gain-of-function experiments, no genetic evidence for a requirement for this factor in glucose-mediated gene expression has been established. We show here that the transcription of ADD1/SREBP-1c in primary cultures of hepatocytes is controlled positively by insulin and negatively by glucagon and cyclic AMP, establishing a link between this transcription factor and carbohydrate availability. Using adenovirus-mediated transfection of a powerful dominant negative form of ADD1/SREBP-1c in rat hepatocytes, we demonstrate that this factor is absolutely necessary for the stimulation by glucose of L-pyruvate kinase, fatty acid synthase, S14, and acetyl coenzyme A carboxylase gene expression. These results demonstrate that ADD1/SREBP-1c plays a crucial role in mediating the expression of lipogenic genes induced by glucose and insulin.


Figures

FIG. 1
FIG. 1
Effects of insulin and glucose on ADD1/SREBP-1c gene expression in cultured hepatocytes. (A) Hepatocytes were cultured for 16 h in the presence of 5 mM glucose and then incubated for 6 h with or without insulin at a concentration of 1 to 100 nM in the presence of 5 mM glucose. A representative Northern blot as well as the quantification of blots obtained in three independent experiments is shown. (B) Hepatocytes were cultured for 16 h in the presence of 5 mM glucose and then incubated with 100 nM insulin for 1 to 6 h. (C) Hepatocytes were cultured for 16 h in the presence of 5 mM glucose and then incubated for 6 h with 5 or 25 mM glucose in the absence or presence of 100 nM insulin. Total RNAs were extracted and analyzed for the concentration of ADD1/SREBP-1c, FAS, and albumin mRNAs. The Northern blots are representative of three culture experiments. Statistical significance was analyzed by Student’s t test for unpaired data. When quantified, the concentrations of ADD1/SREBP-1c mRNA are expressed as a ratio to the corresponding albumin signal. ∗∗ and ∗∗∗, difference statistically significant for P < 0.01 and P < 0.001, respectively.
FIG. 2
FIG. 2
Effect of glucagon and dibutyryl-cAMP on ADD1/SREBP-1c gene expression in cultured hepatocytes. (A) Hepatocytes were cultured for 16 h in the presence of 5 mM glucose and 100 nM insulin. Cells were then incubated for 24 h with 5 mM glucose and 100 nM insulin in the absence or presence of 1 μM glucagon. (B) Hepatocytes were cultured for 16 h in the presence of 5 mM glucose and 100 nM insulin and then incubated for 6 h with 5 mM glucose and 100 nM insulin in the absence or presence of increasing concentrations of 5 to 100 μM dibutyryl-cAMP (Bt2-cAMP). Total RNAs were extracted and analyzed for the expression of ADD1/SREBP-1c, PEPCK, and albumin mRNAs. A representative Northern blot as well as the quantification of blots obtained in three independent experiments is shown. When quantified, the concentrations of ADD1/SREBP-1c mRNA are expressed as a ratio to the corresponding albumin signal. ∗ and ∗∗, difference statistically significant for P < 0.05 and P < 0.01, respectively.
FIG. 3
FIG. 3
Effects of insulin and glucagon on ADD1/SREBP-1c gene transcription in cultured hepatocytes. (A) Hepatocytes were cultured for 16 h in the presence of 5 mM glucose (G 5) and then incubated for 1 h with 5 mM glucose in the presence or absence of 100 nM insulin (Ins). (B) Hepatocytes were cultured for 16 h in the presence of 5 mM glucose and 100 nM insulin and then incubated for 1 h in the presence of 5 mM glucose and 100 nM insulin with or without 1 μM glucagon. Nuclei were isolated from cultured cells as described in Materials and Methods. The radiolabeled transcripts were hybridized to dot-blotted cDNAs for ADD1/SREBP-1c, PEPCK, and albumin and to pSV Sport1, the plasmid into which ADD1/SREBP-1c cDNA was cloned. The blot is representative of two experiments.
FIG. 4
FIG. 4
Effects of insulin and dibutyryl-cAMP on ADD1/SREBP-1c gene expression in the presence of cycloheximide. (A) Hepatocytes were cultured for 16 h in the presence of 5 mM glucose and then incubated 15 min in the presence of 5 μM cycloheximide before addition of 100 nM insulin for 6 h. (B) Hepatocytes were cultured for 16 h in the presence of 5 mM glucose and insulin and then incubated for 15 min in the presence of cycloheximide before addition of 100 μM dibutyryl-cAMP (Bt2AMPc) for 6 h. The Northern blot presented is representative of two experiments.
FIG. 5
FIG. 5
Effect of the dominant negative form of ADD1/SREBP-1c on the binding of ADD1-403 and USF on the E box of the FAS gene in a gel mobility shift assay. Similar amounts of in vitro-translated ADD1/SREBP-1c (lanes 2 to 5) and human USF 1 (lanes 6 to 9) were added to labeled FAS oligonucleotide in the absence (lanes 2 and 6) or presence (lanes 3 to 5 and 7 to 9) of increasing amounts (microliters) of in vitro-translated ADD1-DN.
FIG. 6
FIG. 6
Effect of a dominant negative form of ADD1/SREBP-1c on glycolytic and lipogenic gene expression in cultured rat hepatocytes. Hepatocytes were cultured for 16 h in the presence of 5 mM glucose, 100 nM dexamethasone, 100 nM T3, and 100 nM insulin. Hepatocytes were then incubated for 120 min with hormones either without Ad (control incubation) or with Ad null (30 PFU/cell) or Ad ADD1-DN (0.3, 3, and 30 PFU/cell). The medium was replaced by fresh medium containing hormones and 5 or 25 mM glucose. After 24 h, total RNAs were extracted and analyzed for the expression of ADD1-DN and endogenous ADD1/SREBP-1c expression (A) and for the expression of FAS, ACC, S14, L-PK, AGE, GAPDH, ApoAI, and β-actin (B). A representative Northern blot as well as the quantification of blots for FAS, ACC, S14, and L-PK expression, obtained in two independent experiments, is shown. When quantified, the concentrations of mRNAs are expressed as a ratio to the corresponding albumin signal and as a percentage of the value obtained in the presence of 25 mM glucose.
FIG. 7
FIG. 7
Effect of a dominant negative form of ADD1/SREBP-1c on T3-induced S14 expression in cultured rat hepatocytes. Hepatocytes were cultured for 16 h in the presence of 5 mM glucose and then incubated for 120 min at 37°C in M199–5 mM glucose either without Ad (control incubation) or with Ad null (30 PFU/cell) or Ad ADD1-DN (30 PFU/cell). The medium was replaced by fresh medium containing 100 nM T3. After 24 h, total RNAs were extracted and analyzed for the expression of S14 and albumin. A representative Northern blot of two culture experiments is shown.
FIG. 8
FIG. 8
Effect of a dominant negative form of ADD1/SREBP-1c on lipid accumulation in cultured rat hepatocytes. Hepatocytes were cultured for 16 h in the presence of 5 mM glucose, 100 nM dexamethasone, 100 nM T3, and 100 nM insulin and then incubated for 120 min at 37°C in M199–5 mM glucose and the same hormones either without Ad (control incubation) or with Ad null (30 PFU/cell) or Ad ADD1-DN (30 PFU/cell). The medium was then replaced by fresh medium containing 5 or 25 mM glucose. After 48 h, hepatocytes were stained for the presence of lipid droplets. Microscopic views of cells at a magnification of ×60 are shown.

References

    1. Berry M N, Friend D S. High yield preparation of isolated rat liver parenchymal cells. J Cell Biol. 1969;43:506–520. - PMC - PubMed
    1. Brown M S, Goldstein J L. The SREBP pathway: regulation of cholesterol metabolism by proteolysis of a membrane-bound transcription factor. Cell. 1997;89:331–340. - PubMed
    1. Chomczynski P, Sacchi N. Single step method of RNA isolation by acid guanidinium thiocyanate-phenol-choroform extraction. Anal Biochem. 1987;162:156–159. - PubMed
    1. Coupé C, Perdereau D, Ferré P, Hitier Y, Narkewicz M, Girard J. Lipogenic enzyme activities and mRNA in rat adipose tissue at weaning. Am J Physiol. 1990;258:E126–E133. - PubMed
    1. Doiron B, Cuif M H, Kahn A, Diaz-Guerra M J. Respective roles of glucose, fructose, and insulin in the regulation of the liver-specific pyruvate kinase gene promoter. J Biol Chem. 1994;269:10213–10216. - PubMed

Publication types

MeSH terms

LinkOut - more resources