. 1999 Apr;103(8):1103-11.
doi: 10.1172/JCI5669.

Roles of TH1 and TH2 cytokines in a murine model of allergic dermatitis

Affiliations

Roles of TH1 and TH2 cytokines in a murine model of allergic dermatitis

J M Spergel et al. J Clin Invest. 1999 Apr.

Abstract

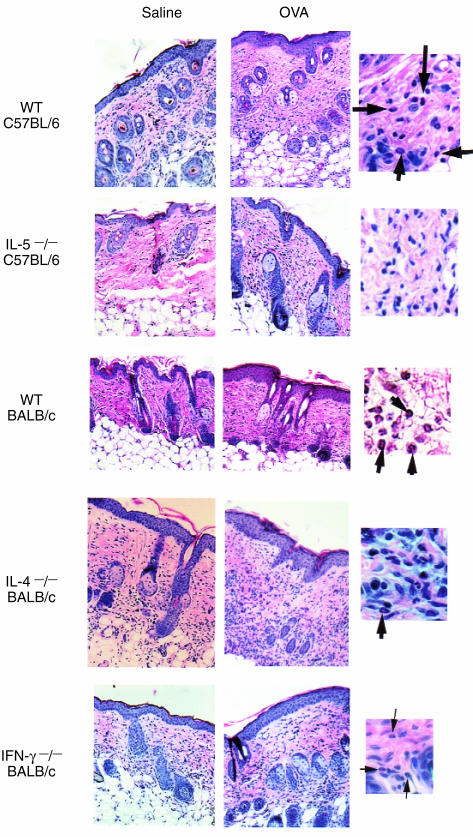
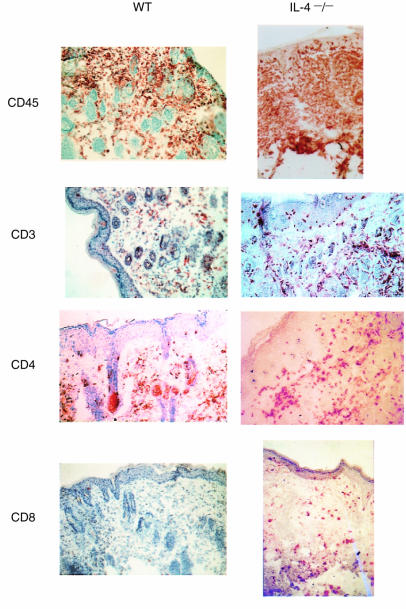
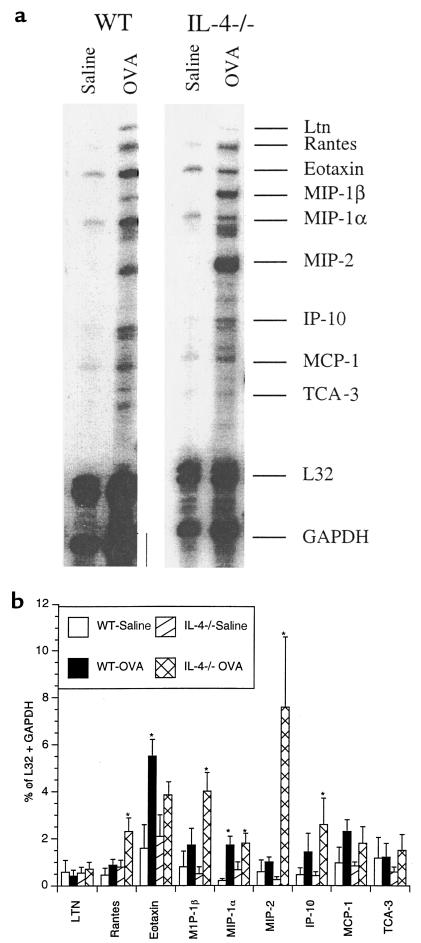
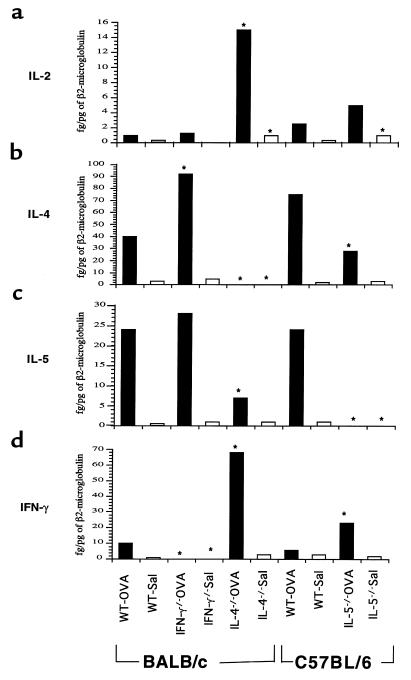
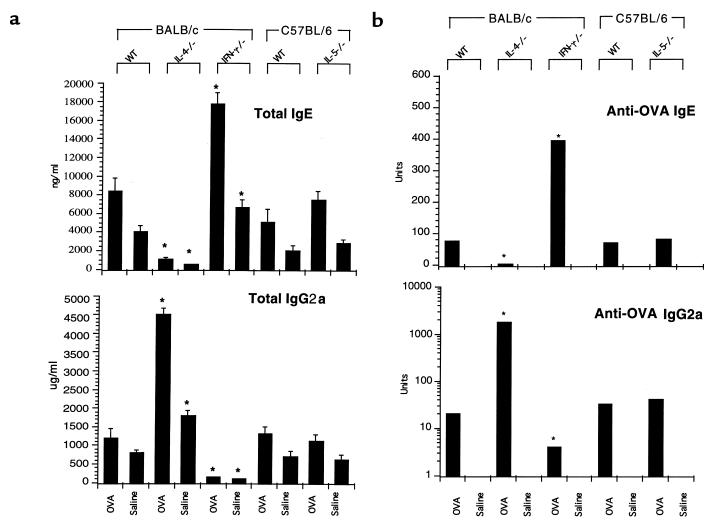
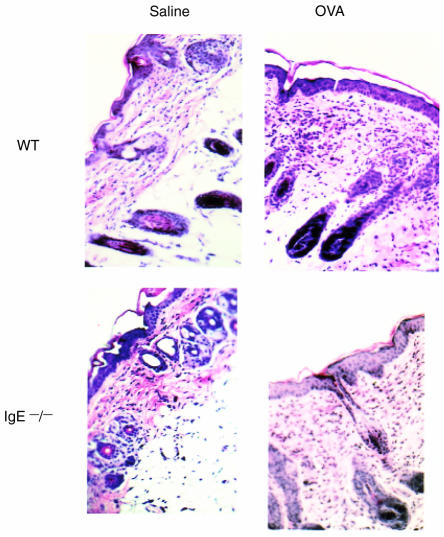
Skin lesions in atopic dermatitis (AD) are characterized by hypertrophy of the dermis and epidermis, infiltration by T cells and eosinophils, and expression of the cytokines IL-4, IL-5, and IFN-gamma. The role of these cytokines in the pathogenesis of AD is not known. We took advantage of a recently described murine model of AD elicited by epicutaneous sensitization with ovalbumin (OVA) (1) and of the availability of mice with targeted deletions of the IL-4, IL-5, and IFN-gamma cytokine genes to assess the role of these cytokines in this model.OVA-sensitized skin from IL-5(-/-) mice had no detectable eosinophils and exhibited decreased epidermal and dermal thickening. Sensitized skin from IL-4(-/-) mice displayed normal thickening of the skin layers but had a drastic reduction in eosinophils and a significant increase in infiltrating T cells. These findings were associated with a reduction in eotaxin mRNA and an increase in mRNA for the T-cell chemokines macrophage inflammatory protein-2 (MIP-2), MIP-1beta, and RANTES. Sensitized skin from IFN-gamma-/- mice was characterized by reduced dermal thickening. These results suggest that both the TH2 cytokines IL-4 and IL-5 and the TH1 cytokine IFN-gamma play important roles in the inflammation and hypertrophy of the skin in AD.


Figures

Figure 1
Figure 1
Histological features of OVA-sensitized and saline-sensitized skin sites. Skin sections were stained with H&E. Magnification for large panels: ×200 ; small panels: ×800. Arrowheads point to eosinophils. The epidermal layer of IL-5 –/– mice does not contain as many cell layers as its WT control, and there is less thickening of the dermal layer. IL-4–/– mice have an increased cellular infiltrate and decreased eosinophils compared with WT mice. The IFN-γ–/– mice have decreased thickness of dermal layer.
Figure 2
Figure 2
Immunohistochemical staining of OVA-sensitized skin sites in WT BALB/c and IL-4–/– mice. IL-4–/– mice show an increase in the number of CD45+, CD3+, CD4+, and CD8+ cells. Magnification: ×200. Positive cells stain brown.
Figure 3
Figure 3
RNase protection assay for chemokine expression. (a) The OVA-sensitized IL-4 –/– mice have a strong signal for MIP-1β and MIP-2 and a less-intense signal for eotaxin compared with OVA-sensitized WT controls. Undigested labeled 32P probes were used as markers, and bands were matched to chemokines based on the predicted digested length. The samples were run on acrylamide (30:2) and exposed to Kodak X-AR film. (b) Pooled results of experiments using 10 OVA-sensitized mice and 10 saline-sensitized controls with duplicate biopsies. Intensity was determined by using a QuantiScan densitometer, and analysis of integration peaks were done with ImageQuant software. Samples were normalized to the combined L32 and GAPDH intensity. Columns represent mean ± SE. *P = 0.05 compared with saline.
Figure 4
Figure 4
RT-PCR analysis of IL-2, IL-4, IL-5, IFN-γ, and β2-microglobulin mRNA levels in the skin biopsies from skin sites of mice sensitized with OVA or saline. Levels were normalized to β2-microglobulin. The filled bars represent the OVA-sensitized mice, and open bars represent the saline-sensitized mice. Pooled results of experiments using four OVA-sensitized mice and four saline-sensitized controls in duplicate for each strain of mice. IL-4–/– and IFN-γ–/– mice are in BALB/c background, and IL-5 –/– mice are in C57BL/6 background. (a) IL-2 levels. (b) IL-4 levels. (c) IL-5 levels. (d) IFN-γ levels. Bars represent mean ± SE. *P < 0.05 compared with WT controls.
Figure 5
Figure 5
Serum immunoglobulin and OVA-specific antibody levels. (a) Total IgE and IgG2a were determined by ELISA (four mice per group). (b) OVA-specific IgE and IgG2a antigen-specific antibodies were determined by ELISA (four mice per group). The columns and error bar represent mean ± SE. *P < 0.05 compared with WT controls.
Figure 6
Figure 6
Histological features of OVA-sensitized and saline-sensitized skin sites of IgE–/– and WT 129Sv controls.

References

    1. Herz U, Bunikowski R, Renz H. Role of T cells in atopic dermatitis. Int Arch Allergy Immunol. 1998;115:179–190. - PubMed
    1. Leung DYM. Immunopathology of atopic dermatitis. Springer Semin Immunopathol. 1992;13:427–440. - PubMed
    1. Leiferman KM, et al. Dermal deposition of eosinophil-granule major basic protein in atopic dermatitis: comparison with onchocerciasis. N Engl J Med. 1985;313:282–285. - PubMed
    1. Cheng J, et al. Dermal eosinophils in atopic dermatitis undergo cytolytic degeneration. J Allergy Clin Immunol. 1997;99:683–692. - PubMed
    1. Yamamoto S, Hamasaki Y, Ishii E, Ichimaru T, Miyazaki S. Unbalanced production of interleukin-5 and interleukin-2 in children with atopic dermatitis. Ann Allergy Asthma Immunol. 1997;78:517–523. - PubMed

Publication types

MeSH terms