

Large neutral amino acids block phenylalanine transport into brain tissue in patients with phenylketonuria
- PMID: 10207169
- PMCID: PMC408272
- DOI: 10.1172/JCI5017
Large neutral amino acids block phenylalanine transport into brain tissue in patients with phenylketonuria
Abstract
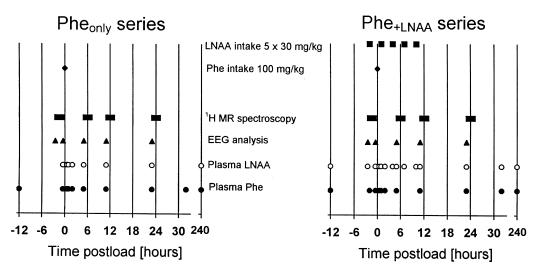
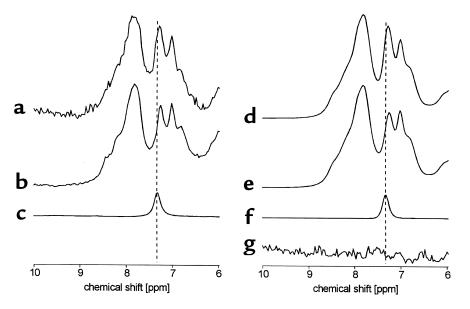
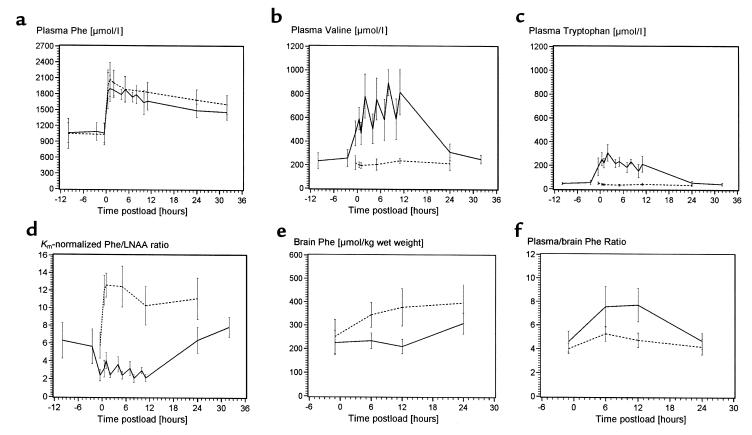
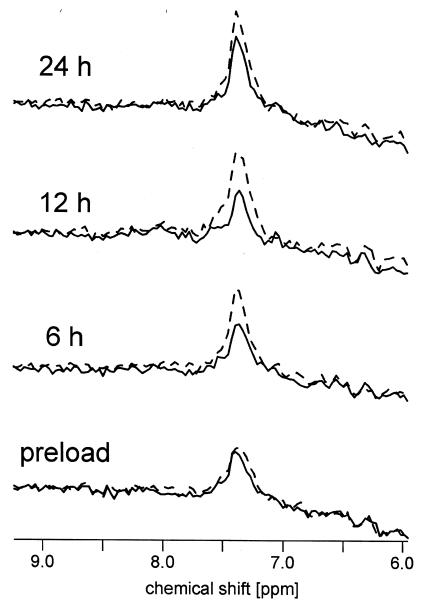
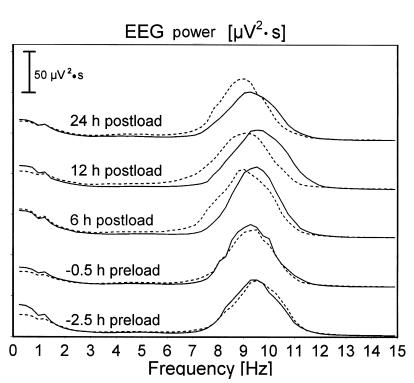
Large neutral amino acids (LNAAs), including phenylalanine (Phe), compete for transport across the blood-brain barrier (BBB) via the L-type amino acid carrier. Accordingly, elevated plasma Phe impairs brain uptake of other LNAAs in patients with phenylketonuria (PKU). Direct effects of elevated brain Phe and depleted LNAAs are probably major causes for disturbed brain development and function in PKU. Competition for the carrier might conversely be put to use to lower Phe influx when the plasma concentrations of all other LNAAs are increased. This hypothesis was tested by measuring brain Phe in patients with PKU by quantitative 1H magnetic resonance spectroscopy during an oral Phe challenge with and without additional supplementation with all other LNAAs. Baseline plasma Phe was approximately 1,000 micromol/l and brain Phe was approximately 250 micromol/l in both series. Without LNAA supplementation, brain Phe increased to approximately 400 micromol/l after the oral Phe load. Electroencephalogram (EEG) spectral analysis revealed acutely disturbed brain activity. With concurrent LNAA supplementation, Phe influx was completely blocked and there was no slowing of EEG activity. These results are relevant for further characterization of the LNAA carrier and of the pathophysiology underlying brain dysfunction in PKU and for treatment of patients with PKU, as brain function might be improved by continued LNAA supplementation.
Figures
Similar articles
-
Future role of large neutral amino acids in transport of phenylalanine into the brain.Pediatrics. 2003 Dec;112(6 Pt 2):1570-4. Pediatrics. 2003. PMID: 14654667
-
The effects of large neutral amino acid supplements in PKU: an MRS and neuropsychological study.Mol Genet Metab. 2007 May;91(1):48-54. doi: 10.1016/j.ymgme.2007.02.002. Epub 2007 Mar 23. Mol Genet Metab. 2007. PMID: 17368065 Clinical Trial.
-
Therapeutic brain modulation with targeted large neutral amino acid supplements in the Pah-enu2 phenylketonuria mouse model.Am J Clin Nutr. 2016 Nov;104(5):1292-1300. doi: 10.3945/ajcn.116.135996. Epub 2016 Sep 21. Am J Clin Nutr. 2016. PMID: 27655443
-
In vivo proton magnetic resonance spectroscopy in phenylketonuria.Eur J Pediatr. 2000 Oct;159 Suppl 2:S121-5. doi: 10.1007/pl00014374. Eur J Pediatr. 2000. PMID: 11043158 Review.
-
Optimising amino acid absorption: essential to improve nitrogen balance and metabolic control in phenylketonuria.Nutr Res Rev. 2019 Jun;32(1):70-78. doi: 10.1017/S0954422418000173. Epub 2018 Oct 4. Nutr Res Rev. 2019. PMID: 30284526 Free PMC article. Review.
Cited by
-
A comparative analysis of biclustering algorithms for gene expression data.Brief Bioinform. 2013 May;14(3):279-92. doi: 10.1093/bib/bbs032. Epub 2012 Jul 6. Brief Bioinform. 2013. PMID: 22772837 Free PMC article.
-
High phenylalanine concentrations induce demyelination and microglial activation in mouse cerebellar organotypic slices.Front Neurosci. 2022 Sep 29;16:926023. doi: 10.3389/fnins.2022.926023. eCollection 2022. Front Neurosci. 2022. PMID: 36248632 Free PMC article.
-
Psychiatric and Cognitive Aspects of Phenylketonuria: The Limitations of Diet and Promise of New Treatments.Front Psychiatry. 2019 Sep 10;10:561. doi: 10.3389/fpsyt.2019.00561. eCollection 2019. Front Psychiatry. 2019. PMID: 31551819 Free PMC article. Review.
-
Metabolic Disorders and Anesthesia.Curr Anesthesiol Rep. 2019 Sep;9(3):340-359. doi: 10.1007/s40140-019-00345-w. Epub 2019 Jul 12. Curr Anesthesiol Rep. 2019. PMID: 31406490 Free PMC article.
-
1H MR chemical shift imaging detection of phenylalanine in patients suffering from phenylketonuria (PKU).Eur Radiol. 2004 Oct;14(10):1895-900. doi: 10.1007/s00330-004-2388-z. Epub 2004 Aug 3. Eur Radiol. 2004. PMID: 15378255
References
-
- Krause W, Epstein C, Averbook A, Dembure P, Elsas L. Phenylalanine alters the mean power frequency of electroencephalograms and plasma L-DOPA in treated patients with phenylketonuria. Pediatr Res. 1986;20:1112–1116. - PubMed
-
- Pietz J, et al. EEGs in phenylketonuria. I. Follow-up to adulthood. II. Short-term diet-related changes in EEGs and cognitive function. Dev Med Child Neurol. 1993;35:54–64. - PubMed
-
- Lou HC. Large doses of tryptophan and tyrosine as potential therapeutic alternative to dietary phenylalanine restriction in phenylketonuria [letter] Lancet. 1985;2:150–151. - PubMed
-
- Berry HK, Brunner RL, Hunt MM, White PP. Valine, isoleucine and leucine. A new treatment for phenylketonuria. Am J Dis Child. 1990;144:539–543. - PubMed
Publication types
MeSH terms
Substances
LinkOut - more resources
Full Text Sources
Other Literature Sources
Medical
