Review
. 1999 Feb;85(1):12-8.

Multispecies Plasmodium infections of humans

Affiliations
Review

Multispecies Plasmodium infections of humans

F E McKenzie et al. J Parasitol. 1999 Feb.

Abstract

We analyzed point-prevalence data from 19 recent studies of human populations in which either Plasmodium ovale or Plasmodium vivax co-occur with Plasmodium falciparum and Plasmodium malariae. Although the only statistical interactions among, sympatric congeners are pairwise, the frequencies of mixed-species infections relative to standard hypotheses of species sampling independence show no strong relation to overall malaria prevalence. The striking difference between the P. falciparum-P. malariae-P. ovale and the P. falciparum-P. malariae-P. vivax data is that the first typically shows a statistical surplus of mixed-species infections and the second a deficit. This suggests that the number of Plasmodium species present in a human population may be less important in determining the frequencies of mixed-species infections than is the identity of those species.


Figures
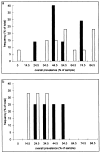
Figure 1
Figure 1
Relationships between overall prevalence of infection (horizontal axis) and frequency (vertical axis) of tables that show significant (solid bars) or nonsignificant (hollow bars) differences in mixed-species infections from the expected values for a) P. falciparum–P. malariae–P. ovale and b) P. falciparum–P. malariae–P. vivax. The numbers on the horizontal axis represent midpoints of percentage prevalence intervals, e.g., 14.5 represents the interval 10–19%; numbers on the vertical axis represent percentages of the total number of tables within the relevant group (significant or nonsignificant).
Figure 2
Figure 2
Relationships between overall prevalence of infection (horizontal axis) and frequency (vertical axis) of tables that show significant (solid bars) or nonsignificant (hollow bars) differences in mixed-species infections from the expected values for the 1911–1929 3-species tables (see text). Conventions are as in Figure 1.
Figure 3
Figure 3
In P. falciparum–P. malariae–P. ovale tables, observed frequencies in single-species cells were generally lower and in dual-species cells generally higher than those expected under the hypothesis of complete species independence, while the reverse was typical of P. falciparum–P. malariae–P. vivax tables. The shared P. falciparum–P. malariae pair illustrates most of this pattern. In part a, the horizontal axis indicates each of the single-species or dual-species cells, with abbreviations as in the tables; the vertical axis represents frequencies with which observed cell values fell below the values expected under complete independence, for the modern P. falciparum–P. malariae–P. ovale (solid bars), modern P. falciparum–P. malariae–P. vivax (hollow bars) and historical P. falciparum–P. malariae–P. vivax (hatched bars) tables. Part b shows ratios of observed to expected values in the single-species P. falciparum (F) and P. malariae (M) cells and the dual P. falciparum–P. malariae (FM) cell, as a mean value ± 1 standard deviation, in the significant modern P. falciparum–P. malariae–P. ovale (F, M, O) and P. falciparum–P. malariae–P. vivax (F, M, V) tables.
Figure 4
Figure 4
Data from human populations with 2, 3, or 4 sympatric Plasmodium species imply that neither the overall prevalence of malaria nor the fraction of infections that are mixed-species relate simply to the number of species present. The horizontal axes indicate the 2-species, 3-species, and 4-species data sets, with abbreviations as before (and F, M, X for the 1911–1929 data set), and again a mean value ± 1 standard deviation. In part a, the vertical axis indicates the overall malaria prevalence, and in part b, the vertical axis indicates the ratio of mixed-species to total infections. References for the 2-species data are in McKenzie and Bossert (1997a) for the 3-species data are in Table I and for the 4-species data are Blanchy et al. (1990), Lepers et al. (1990), Denys and Isautier (1991), Anthony et al. (1992), McLaughlin et al. (1993), and Seesod et al. (1997).

References

    1. Andrysiak PM, Collins WE, Campbell GH. Stage-specific and species-specific antigens of P. vivax and P. ovale defined by monoclonal antibodies. Infection and Immunity. 1986;54:609–612. - PMC - PubMed
    1. Anthony RL, Bangs MJ, Hamzah N, Basri Purnomo H, Subianto B. Heightened transmission of stable malaria in an isolated population in the highlands of Irian Jaya, Indonesia. American Journal of Tropical Medicine and Hygiene. 1992;47:346–356. - PubMed
    1. Banchongaksorn T, Yomokgul P, Panyim S, Rooney W, Vickers P. A field trial of the ParaSight™-F test for the diagnosis of Plasmodium falciparum infection. Transactions of the Royal Society of Tropical Medicine and Hygiene. 1996;90:244–245. - PubMed
    1. Barnwell JW, Galinski MR. Plasmodium vivax: A glimpse into the unique and shared biology of the merozoite. Annals of Tropical Medicine and Parasitology. 1995;89:113–120. - PubMed
    1. Bate CAW, Taverne J, Karunaweera ND, Mendis KN, Kwiatkowski D, Playfair JHL. Serological relationship of tumor necrosis factor-inducing exoantigens of Plasmodium falciparum and Plasmodium vivax. Infection and Immunity. 1992;54:1241–1243. - PMC - PubMed

Publication types

LinkOut - more resources