

Elasticity measurements show the existence of thin rigid cores inside mitotic chromosomes
- PMID: 10209019
- PMCID: PMC2133105
- DOI: 10.1083/jcb.145.2.215
Elasticity measurements show the existence of thin rigid cores inside mitotic chromosomes
Abstract
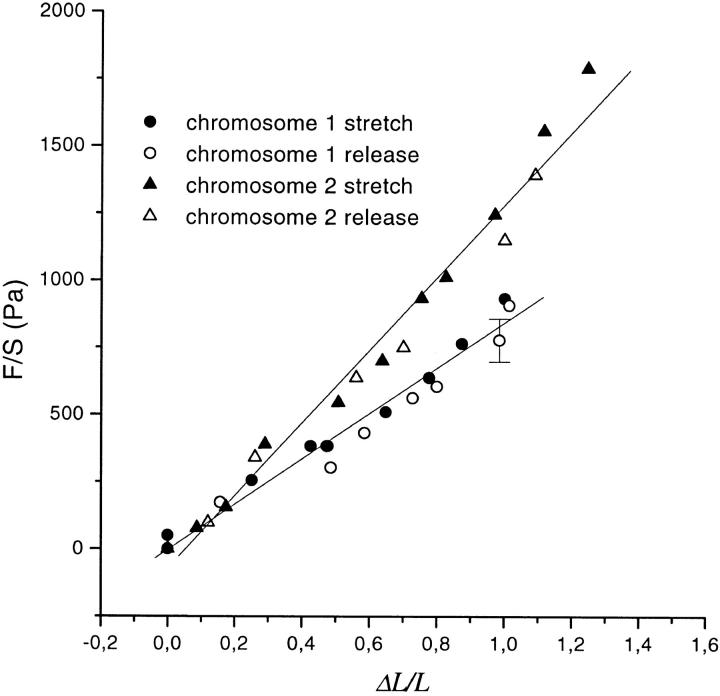
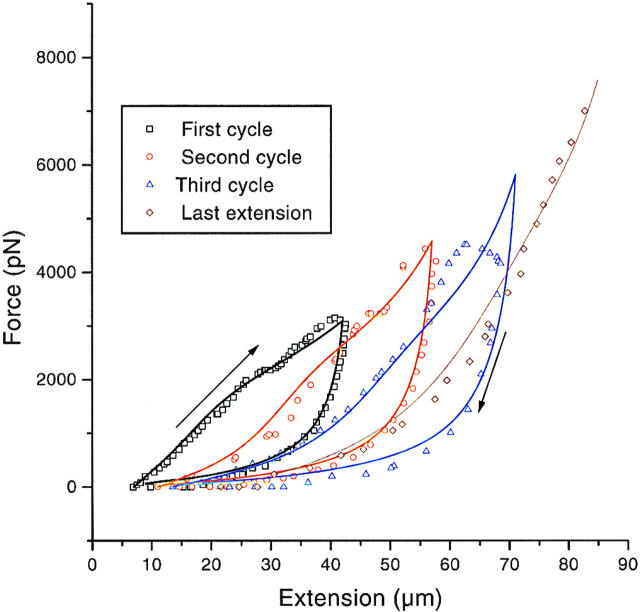
Chromosome condensation is one of the most critical steps during cell division. However, the structure of condensed mitotic chromosomes is poorly understood. In this paper we describe a new approach based on elasticity measurements for studying the structure of in vitro assembled mitotic chromosomes in Xenopus egg extract. The approach is based on a unique combination of measurements of both longitudinal deformability and bending rigidity of whole chromosomes. By using specially designed micropipettes, the chromosome force-extension curve was determined. Analysis of the curvature fluctuation spectrum allowed for the measurement of chromosome bending ridigity. The relationship between the values of these two parameters is very specific: the measured chromosome flexibility was found to be 2,000 times lower than the flexibility calculated from the experimentally determined Young modulus. This requires the chromosome structure to be formed of one or a few thin rigid elastic axes surrounded by a soft envelope. The properties of these axes are well-described by models developed for the elasticity of titin-like molecules. Additionally, the deformability of in vitro assembled chromosomes was found to be very similar to that of native somatic chromosomes, thus demonstrating the existence of an essentially identical structure.
Figures


Similar articles
-
The mitotic chromosome is an assembly of rigid elastic axes organized by structural maintenance of chromosomes (SMC) proteins and surrounded by a soft chromatin envelope.J Biol Chem. 2004 Feb 13;279(7):5118-26. doi: 10.1074/jbc.M307221200. Epub 2003 Dec 1. J Biol Chem. 2004. PMID: 14660618
-
Assembly and micromanipulation of Xenopus in vitro-assembled mitotic chromosomes.Curr Protoc Cell Biol. 2005 Apr;Chapter 22:Unit 22.9. doi: 10.1002/0471143030.cb2209s26. Curr Protoc Cell Biol. 2005. PMID: 18228470
-
The bending rigidity of mitotic chromosomes.Mol Biol Cell. 2002 Jun;13(6):2170-9. doi: 10.1091/mbc.01-08-0401. Mol Biol Cell. 2002. PMID: 12058078 Free PMC article.
-
Nuclear envelopes. Structure and biochemistry of the nuclear envelope.Philos Trans R Soc Lond B Biol Sci. 1974 Jul 25;268(891):67-93. doi: 10.1098/rstb.1974.0016. Philos Trans R Soc Lond B Biol Sci. 1974. PMID: 4155092 Review. No abstract available.
-
[Centromere elasticity].Med Sci (Paris). 2005 Mar;21(3):261-6. doi: 10.1051/medsci/2005213261. Med Sci (Paris). 2005. PMID: 15745699 Review. French.
Cited by
-
D-Titin: a giant protein with dual roles in chromosomes and muscles.J Cell Biol. 2000 Oct 30;151(3):639-52. doi: 10.1083/jcb.151.3.639. J Cell Biol. 2000. PMID: 11062264 Free PMC article.
-
Core histone N-termini play an essential role in mitotic chromosome condensation.EMBO J. 2000 Feb 1;19(3):379-91. doi: 10.1093/emboj/19.3.379. EMBO J. 2000. PMID: 10654937 Free PMC article.
-
Assays for mitotic chromosome condensation in live yeast and mammalian cells.Chromosome Res. 2009;17(2):145-54. doi: 10.1007/s10577-008-9010-1. Chromosome Res. 2009. PMID: 19308697 Review.
-
Micromechanical studies of mitotic chromosomes.J Muscle Res Cell Motil. 2002;23(5-6):409-31. J Muscle Res Cell Motil. 2002. PMID: 12785094 Review.
-
Structural reorganization and relaxation dynamics of axially stressed chromosomes.Biophys J. 2023 May 2;122(9):1633-1645. doi: 10.1016/j.bpj.2023.03.029. Epub 2023 Mar 22. Biophys J. 2023. PMID: 36960531 Free PMC article.
References
-
- Chassery, J., and A. Montanvert. 1991. Geometrie Discrete en Analyse d'Image. Hermes, Paris.
-
- Doi, M., and S.F. Edwards. 1986. The Theory of Polymer Dynamics. Oxford University Press, Oxford.
-
- Earnshaw WC. Large scale chromosome structure and organization. Curr Opin Struct Biol. 1991;1:237–244.
