. 1999 Apr 19;145(2):305-15.
doi: 10.1083/jcb.145.2.305.

An essential role for katanin in severing microtubules in the neuron

Affiliations

An essential role for katanin in severing microtubules in the neuron

F J Ahmad et al. J Cell Biol. .

Abstract

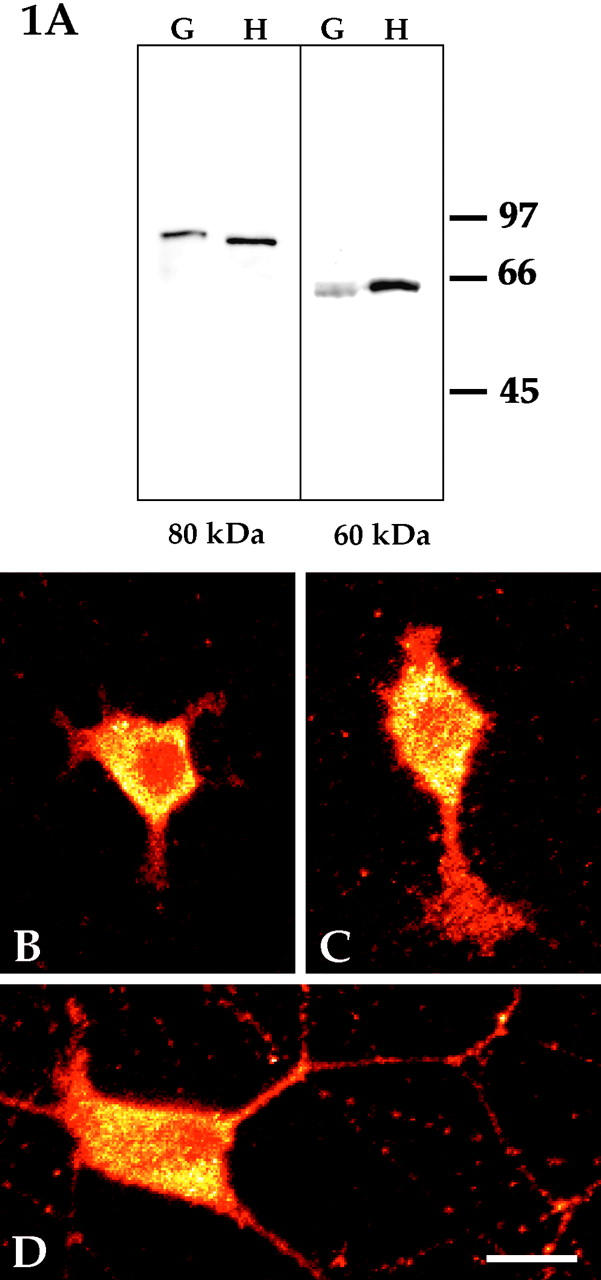
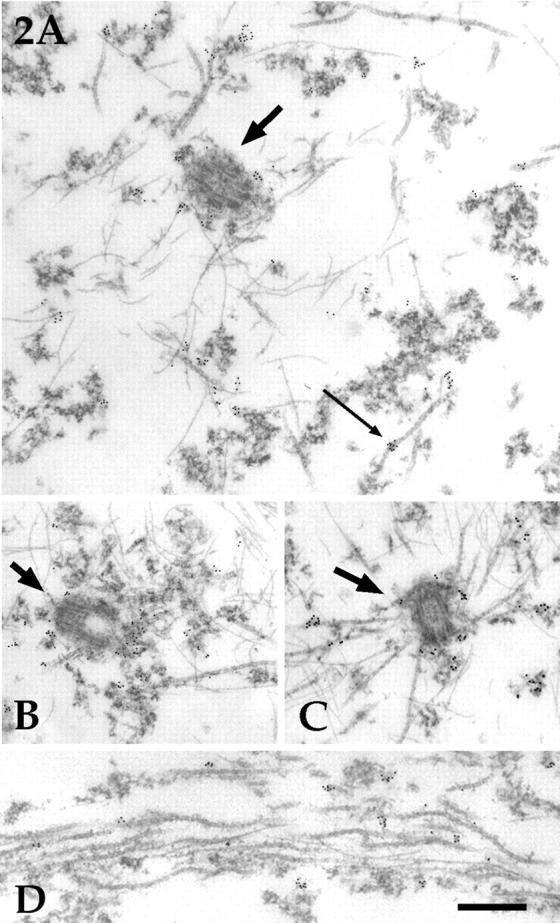
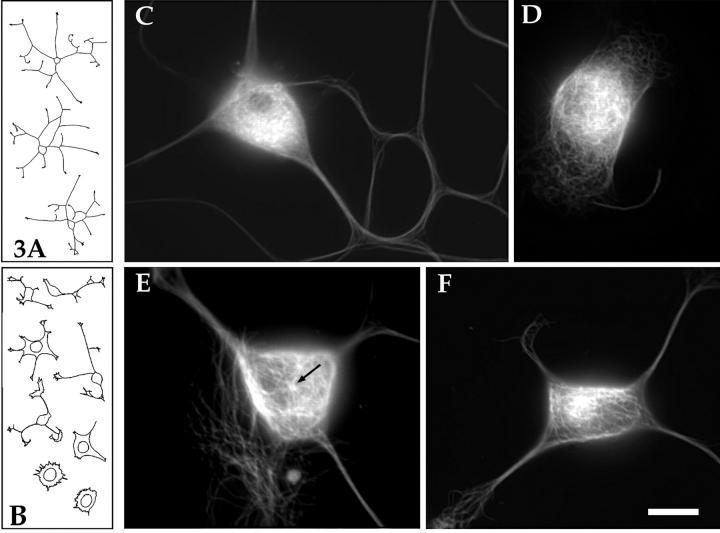
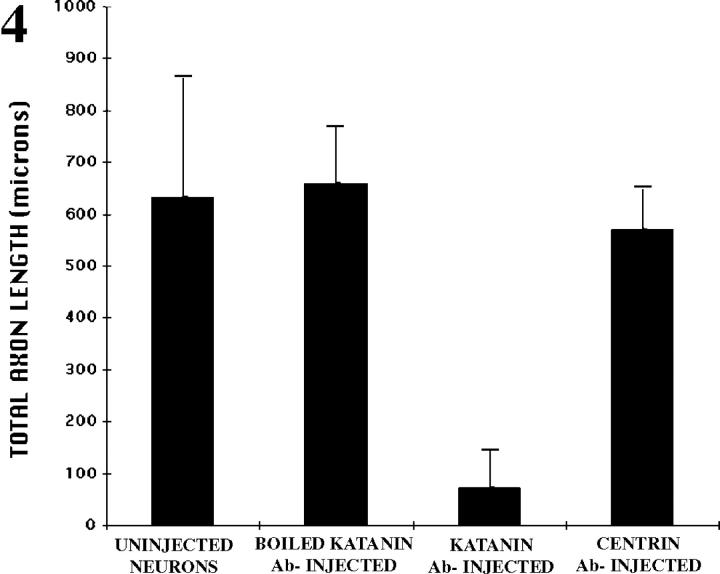
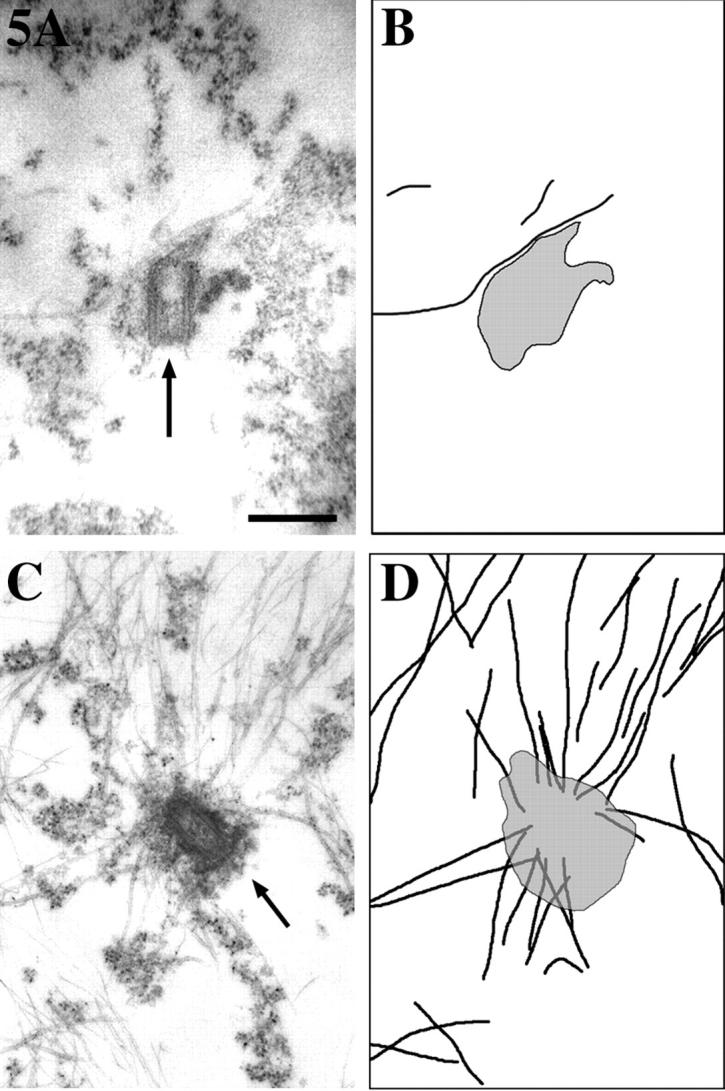
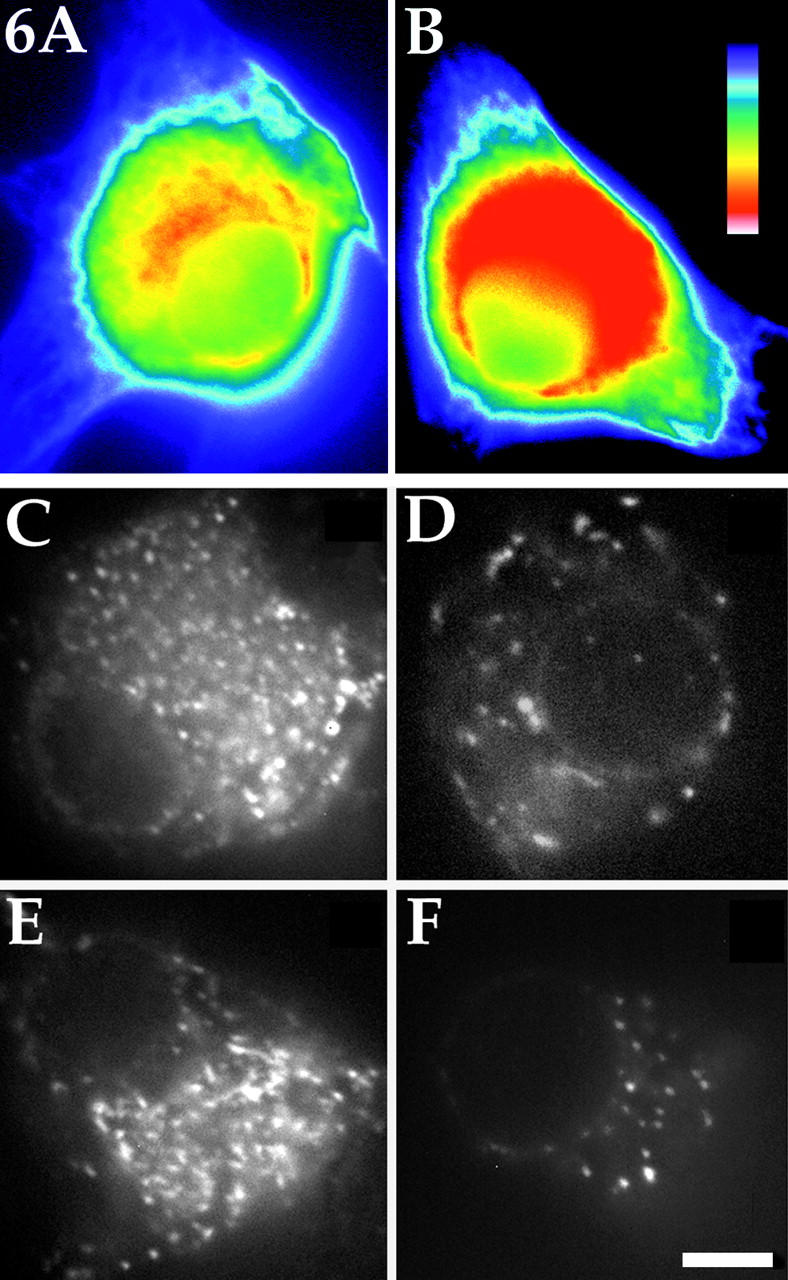
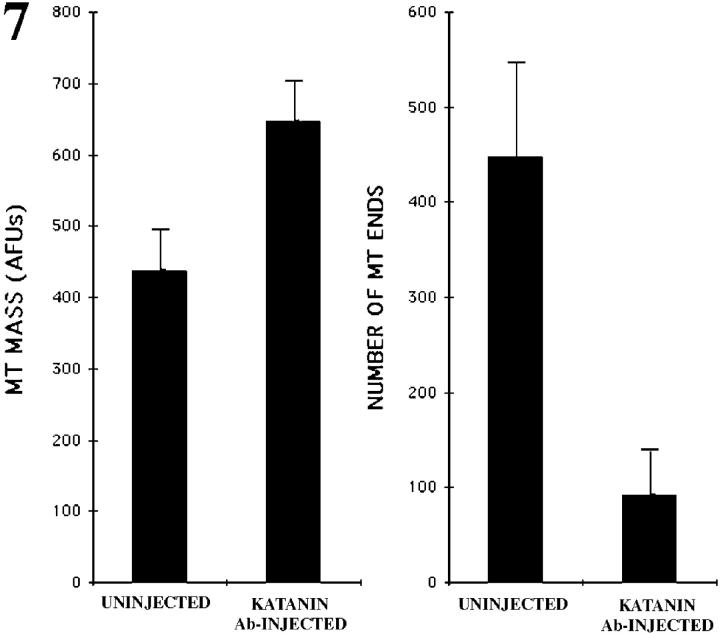
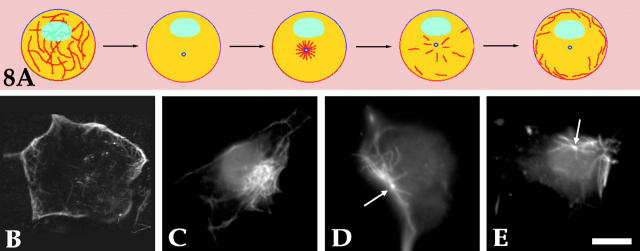
Several lines of evidence suggest that microtubules are nucleated at the neuronal centrosome, and then released for transport into axons and dendrites. Here we sought to determine whether the microtubule-severing protein known as katanin mediates microtubule release from the neuronal centrosome. Immunomicroscopic analyses on cultured sympathetic neurons show that katanin is present at the centrosome, but is also widely distributed throughout the neuron. Microinjection of an antibody that inactivates katanin results in a dramatic accumulation of microtubules at the centrosome, indicating that katanin is indeed required for microtubule release from the centrosome. However, the antibody also causes an inhibition of axon outgrowth that is more immediate than expected on this basis alone. It may be that katanin severs microtubules throughout the cell body to keep them sufficiently short to be efficiently transported into developing processes. Consistent with this idea, there were significantly fewer free ends of microtubules in the cell bodies of neurons that had been injected with the katanin antibody compared with controls. These results indicate that microtubule-severing by katanin is essential for releasing microtubules from the neuronal centrosome, and also for regulating the length of the microtubules after their release.


Figures

Figure 1
Figure 1
Western blotting and immunofluorescence analyses of katanin in rat sympathetic neurons. Western blot analyses were performed using affinity-purified polyclonal antibodies that recognize either the 80- (A, left) or 60-kD (A, right) katanin subunit. The blots reveal the presence of both subunits within developing rat sympathetic ganglia. Shown here are samples of superior cervical ganglia from 4-d animals (G) alongside samples from HeLa cells used as a positive control (H). Similar results were obtained with ganglia obtained from E18 and newborn rat pups. Molecular weight standards are indicated in the margin. Immunofluorescence analyses on cultured rat sympathetic neurons revealed the presence of both katanin subunits throughout the neuron at all stages of development. B and C show freshly plated neurons, while D shows a 3-d culture. B is a cell that had flattened against the substrate, but had not yet begun to extend processes. C is a cell that had begun to extend short processes. D is a cell that had extended a complex axonal arbor (and had begun to show signs of dendritic differentiation). Optical sections were obtained with a confocal microscope, and images were depicted in glow-scale pseudocolor to assist in determining whether there was a focal enrichment of katanin in the cell body that might correspond to the centrosome. No such enrichment was observed, indicating that katanin is not specifically concentrated at the centrosome. Shown here are analyses with the antibody to the 60-kD katanin subunit. Similar results were obtained with the antibody to the 80-kD subunit (not shown). Bar, 15 μm.
Figure 2
Figure 2
Immunoelectron microscopic analyses on katanin distribution in rat sympathetic neurons. Shown are immunoelectron micrographs from neurons stained with the antibody against the 60-kD katanin subunit and a second antibody conjugated to 5-nm colloidal gold particles. In all neurons examined, katanin immunoreactivity was detected within or around the pericentriolar material (A–C, thicker arrows point to the centrosome). In addition, katanin immunoreactivity was typically associated with the clusters of amorphous cytoplasmic material that persist extraction (A). Occasionally, immunoreactivity was found at a discrete site along the length of a microtubule (A, thin arrow). There was no correlation between the number of microtubules attached to any given centrosome and the number of gold particles associated with it. C is a rare centrosome with several attached microtubules, but the number of gold particles is no higher than with other centrosomes. Immunoreactivity for katanin was also detected in axons (D) and dendrites (not shown). D is shown at slightly higher magnification than A–C. Bar (A–C), 0.40 μm. Bar (D), 0.30 μm.
Figure 3
Figure 3
Effects of microinjecting neurons with the function-blocking katanin antibody. A shows tracings of typical control neurons roughly 6 h after plating, while B shows tracings of typical antibody-injected neurons (injected roughly 45 min after plating and photographed 5–6 h later). The levels of axon outgrowth were markedly reduced in the antibody-injected cells compared with the uninjected cells. C shows an immunofluorescence micrograph of the microtubule array within a typical control (uninjected) neuron. There is a widespread and relatively even distribution of microtubules throughout the cell body. D shows a neuron that grew no processes after injection with the viable katanin antibody. Microtubules appear throughout the cell body, but, as with uninjected cells, it is impossible to discern whether or not the microtubules are attached to the centrosome. E shows a neuron that extended short processes after injection of the viable katanin antibody. The microtubules have reorganized such that it is clear that several microtubules are attached to a “point source” in the cell body (arrow). In addition, these microtubules are unusually long, extending to the periphery of the cell body. F shows a neuron that grew somewhat longer processes after injection of the viable katanin antibody. In this cell, it is not possible to discern the attachment of microtubules to a point source, but it is clear that many of the microtubules are clustered together near the center of the cell body. There is a particularly bright region of staining within the cluster of microtubules that may correspond to the centrosome. In addition, some of the individual microtubules that can be resolved appear to be unusually long (note the long microtubules extending from the bright cluster toward the right). Bar (A and B), 66 μm. Bar (C–F), 10 μm.
Figure 4
Figure 4
Bar graph showing the total microns of axon growth that occurred over a 5–6-h period of time for uninjected neurons and neurons injected with either boiled katanin antibody, viable katanin antibody, or viable centrin antibody.
Figure 5
Figure 5
Electron micrographs of centrosomes from control and katanin antibody-injected neurons. Neurons treated as described in Fig. 3 were examined by electron microscopy. Shown in this figure are the electron micrographs (A and C) and corresponding tracings to make clearer the microtubules and centrosome, shown in black and gray, respectively (B and D). Control neurons show few or no microtubules attached to the centrosome (A and B). By contrast, antibody-injected neurons show many attached microtubules (C and D). Bar, 0.5 μm.
Figure 6
Figure 6
Quantification of microtubule mass and microtubule ends in control and katanin antibody-injected neuronal cell bodies. To quantify total microtubule mass in the cell body of the neuron, cultures were prepared for immunofluorescence visualization of microtubules 4–5 h after a portion of the neurons had been injected with the function-blocking katanin antibody. There was an increase of roughly 48% in the total microtubule mass in the cell bodies of the antibody-injected neurons compared with the cell bodies of the control neurons. Examples of a cell body of a control and injected neuron displayed in a standard pseudocolor scale are shown in A and B, respectively. The pseudocolor scale is shown in B, with red indicating the most and purple the least intense levels of staining. To quantify microtubule ends, rhodamine-labeled tubulin was injected into the cell bodies of uninjected neurons and neurons that had been injected with the katanin antibody 4–5 h before the injection of the tubulin. 1 min was permitted for the incorporation of fluorescent tubulin onto the free ends of the microtubules, after which the cells were extracted in a microtubule-stabilizing buffer and rapidly imaged. In control cells (C and E), there were four to five times fewer microtubule ends as in antibody-injected cells (D and F). Bar, 5 μm.
Figure 7
Figure 7
Bar graph showing both the total microtubule (MT) mass measured in AFUs and the number of MT ends in the cell bodies of uninjected neurons and neurons that had been injected with the katanin antibody.
Figure 8
Figure 8
Studies using a pharmacologic regime to test the role of katanin in releasing microtubules from the neuronal centrosome. A schematically illustrates the pharmacologic regime for revealing the transport of microtubules from the centrosome to the periphery of the neuronal cell body. Under these conditions, a synchronized burst of microtubules is assembled at the centrosome, and then rapidly released and conveyed to the cell periphery. Here, the katanin antibody was injected shortly after the addition of nocodazole. Shown in B–E are cells prepared for immunofluorescence visualization of microtubules. B shows a cell that had not been injected, with microtubules concentrated beneath the periphery of the cell body after completion of the pharmacologic regime. C–E show three examples of cells that had been injected with the antibody. In all cases, the microtubules remained clustered within a discrete region of the cell body, and did not distribute beneath its periphery. In some cases, a clear point of attachment could not be clearly discerned (C), but in most cases the attachment of the microtubules to the centrosome could be discerned (D and E, arrows). In many cases, the entire centrosome/microtubule complex tended to relocate from cell center to cell periphery. Bar, 8 μm.

References

    1. Ahmad FJ, Baas PW. Microtubules released from the neuronal centrosome are transported into the axon. J Cell Sci. 1995;108:2761–2769. - PubMed
    1. Ahmad FJ, Joshi HC, Frohlich V, Baas PW. Inhibition of microtubule nucleation at the centrosome compromises axon growth. Neuron. 1994;12:271–280. - PubMed
    1. Ahmad FJ, Echeverri CJ, Vallee RB, Baas PW. Cytoplasmic dynein and dynactin are required for the transport of microtubules into the axon. J Cell Biol. 1998;140:391–401. - PMC - PubMed
    1. Baas PW. Microtubules and axonal growth. Curr Opin Cell Biol. 1997;9:29–36. - PubMed
    1. Baas PW. Microtubules and neuronal polarity: lessons from mitosis. Neuron. 1999;22:23–31. - PubMed

Publication types

Substances