. 1999 Apr 19;145(2):331-45.
doi: 10.1083/jcb.145.2.331.

Relationship between Arp2/3 complex and the barbed ends of actin filaments at the leading edge of carcinoma cells after epidermal growth factor stimulation

Affiliations

Relationship between Arp2/3 complex and the barbed ends of actin filaments at the leading edge of carcinoma cells after epidermal growth factor stimulation

M Bailly et al. J Cell Biol. .

Abstract

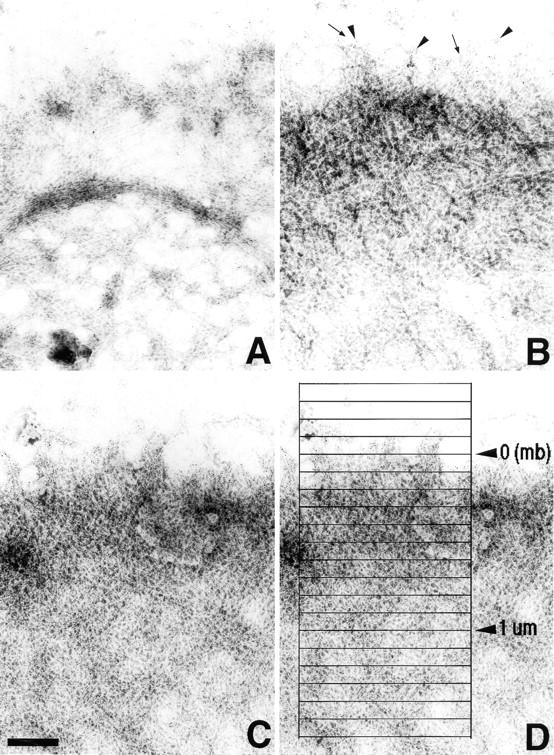
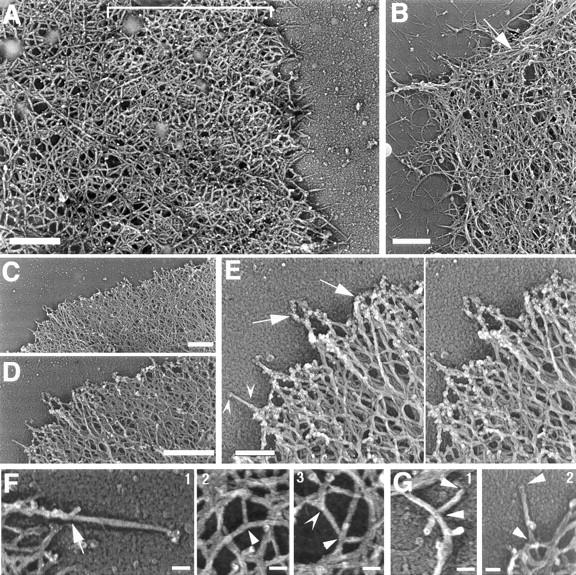
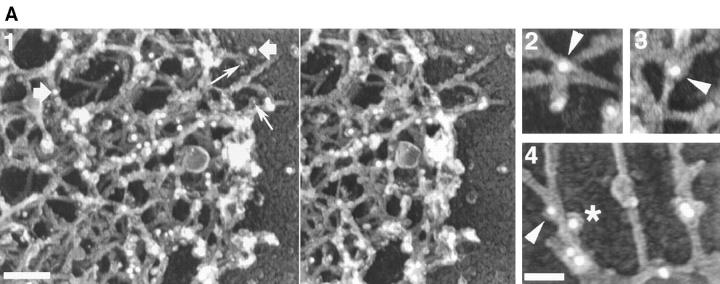
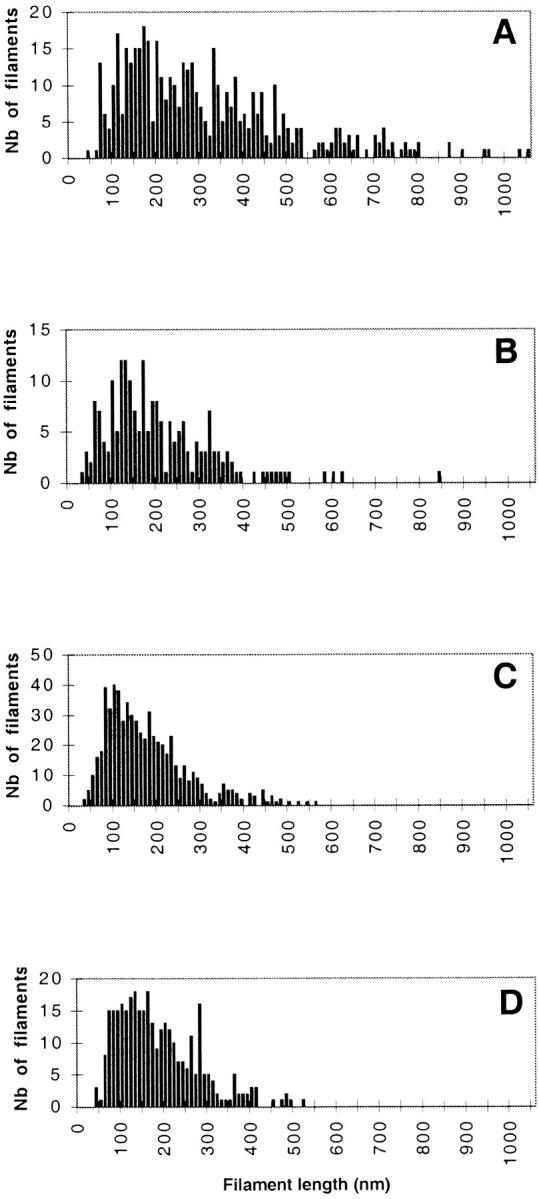
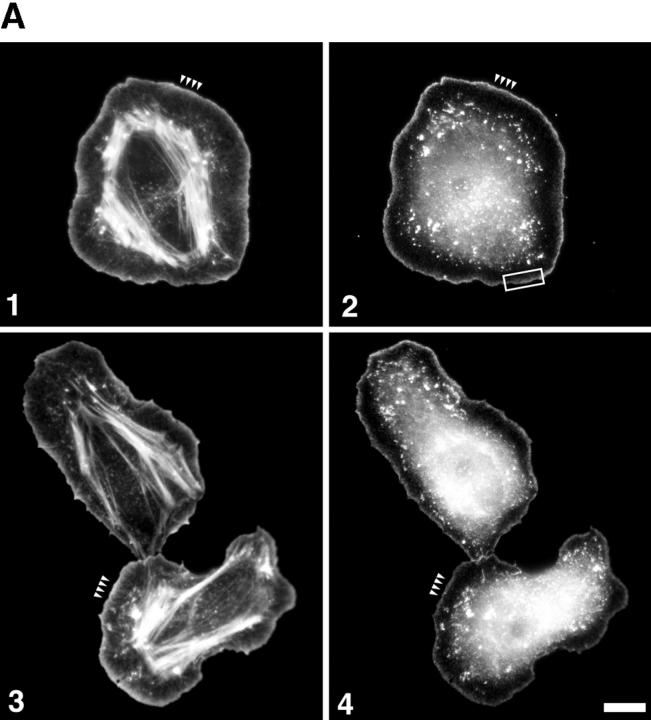
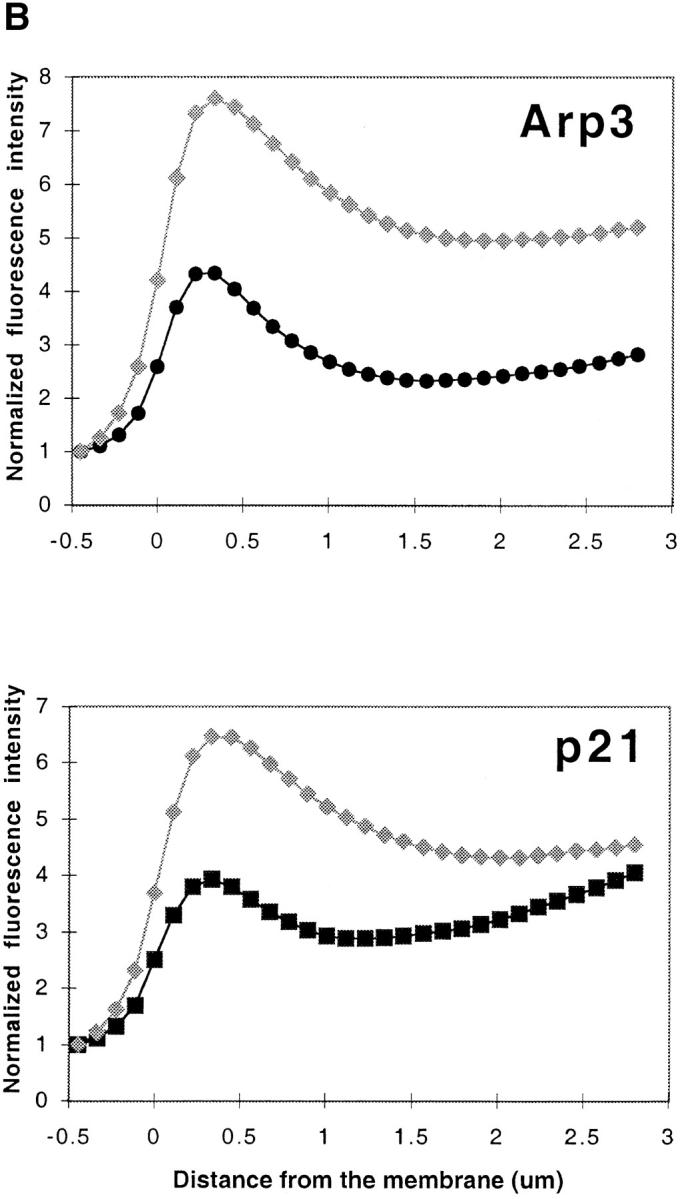
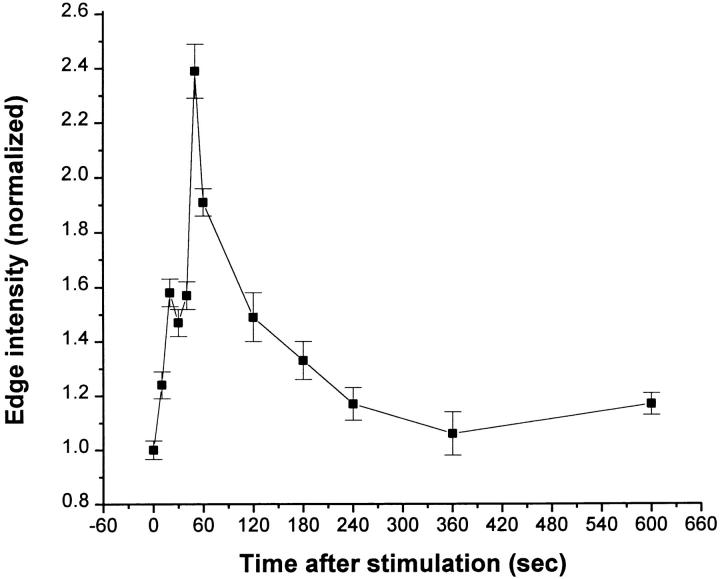
Using both light and high resolution electron microscopy, we analyzed the spatial and temporal relationships between the Arp2/3 complex and the nucleation activity that is required for lamellipod extension in mammary carcinoma cells after epidermal growth factor stimulation. A rapid two- to fourfold increase in filament barbed end number occurs transiently after stimulation and remains confined almost exclusively to the extreme outer edge of the extending lamellipod (within 100-200 nm of the plasma membrane). This is accompanied by an increase in filament density at the leading edge and a general decrease in filament length, with a specific loss of long filaments. Concomitantly, the Arp2/3 complex is recruited with a 1.5-fold increase throughout the entire cortical filament network extending 1-1.5 microm in depth from the membrane at the leading edge. The recruitment of the Arp2/3 complex at the membrane of the extending lamellipod indicates that Arp2/3 may be involved in initial generation of growing filaments. However, only a small subset of the complex present in the cortical network colocalizes near free barbed ends. This suggests that the 100-200-nm submembraneous compartment at the leading edge of the extending lamellipod constitutes a special biochemical microenvironment that favors the generation and maintenance of free barbed ends, possibly through the locally active Arp2/3 complex, severing or decreasing the on-rate of capping protein. Our results are inconsistent with the hypothesis suggesting uncapping is the dominant mechanism responsible for the generation of nucleation activity. However, they support the hypothesis of an Arp2/3-mediated capture of actin oligomers that formed close to the membrane by other mechanisms such as severing. They also support pointed-end capping by the Arp2/3 complex, accounting for its wide distribution at the leading edge.


Figures

Figure 5
Figure 5
Ultrastructural localization of nucleation sites in negatively stained leading edges. Cells were processed as described in Fig. 4. (A) An unstimulated cell edge not organized as a typical lamellipod is shown. Note the loose network and occasional bundling of the filaments, and very low biotin-labeled actin incorporation. (B) The leading edge of a lamellipod in a polarized unstimulated cell organized as a network of dense filaments is shown. Note the filaments growing radially from the edge (arrows), and the biotin-labeled actin incorporation (arrowheads). (C) The leading edge of a cell 1 min after stimulation with EGF is shown. The network of actin filament is denser and the biotin-labeled actin incorporation is abundant. (D) A schematic description of the way the distribution of gold particles was analyzed at the leading edge for morphometrical analysis: boxes of 1 × 0.1 μm2 are shown here as an example. All the analyses were done with 2 × 0.1 μm2 boxes (see Materials and Methods). mb, membrane position (see Fig. 4). Bar, 0.3 μm.
Figure 7
Figure 7
Three-dimensional organization of the cytoskeleton at the leading edge. Cells were stimulated with EGF, permeabilized in the presence of 0.45 μM biotin–actin, and fixed and processed for immunostaining with 5 nm gold-conjugated antibiotin antibodies. Postfixed samples were treated for rotary shadow as described in Materials and Methods. (A) General architecture of the cytoskeleton at the leading edge of the cells 1 min after stimulation with EGF is shown. Note the high density network at the extreme edge (brackets), and the decrease in filament density away from the edge. (B) Bundles of actin filaments at the periphery of a resting cell (arrow). (C) Leading edge of a lamellipod in a cell 1 min after EGF stimulation. (D) A higher magnification of C is shown and (E) a higher magnification of D (stereo view). Note the gold particles decorating the filaments at the extreme edge of the lamellipod (arrows). (F) Different types of branching observed at the leading edge: branching (arrow) on a filament growing radially from the edge that had incorporated exogenous biotin–actin (frame 1); T-branching inside the network at the leading edge (frame 2, arrowhead); ∼70° (Arp2/3-type) branching on unlabeled filaments inside the network (frame 3, arrowhead); Y-branching with small angles inside the network (frame 3, concave arrowhead). (G, frames 1 and 2) Examples of filament length measurement at the leading edge are shown. Filaments were traced to their origin as shown and the length was measured using NIH Image. Arrowheads mark the two ends of the filaments. Bars, A–D, 0.5 μm; E, 0.2 μm; F and G, 0.05 μm.
Figure 4
Figure 4
Negative staining of MTLn3 cells permeabilized in presence of biotin-labeled actin. Cells were stimulated with EGF and permeabilized for 1 min in the presence of 0.45 μM biotin-labeled actin. They were then fixed, immunolabeled with anti-biotin antibodies coupled to 5 nm gold particles, and negatively stained with 1% phosphotungstic acid. The image shows a low magnification of a typical leading edge 1 min after EGF stimulation, where a dense actin network is visible at the extreme edge (facing arrows). The line shows where the membrane position was set for morphometric analysis. Bar, 1 μm.
Figure 6
Figure 6
Morphometric analysis of the distribution of nucleation sites and filament density at the leading edge. (A) Quantitation of nucleation activity at the leading edge was done on negatively stained samples by analyzing the distribution of the gold particles reflecting biotin-labeled actin incorporation, using a macro designed for NIH Image, as described in Fig. 5. All the counts were performed blind: (squares) unstimulated cells, nonlamellipod-like edges (see Fig. 5 A); (open circles) leading edges in unstimulated cells (see Fig. 5 B); (triangles) EGF 30 s; (diamonds) EGF 1 min (see Fig. 5 C); (stars) EGF 3 min; and (closed circles) EGF 5 min. The data shown are from one representative experiment using 5–8 cells per time point. Additional examples of the distribution of barbed ends at the leading edge are shown in Figs. 9 and 10. (B) Quantitation of filament density was performed on the same set of negatively stained samples as in A, with a slight adaptation of the method (see Materials and Methods). The legend is the same as in A, except that (squares) unstimulated cells in regions with no typical leading edge are not shown.
Figure 9
Figure 9
Arp3 and p21 are recruited to the leading edge after stimulation. Cells were permeabilized in the presence of 0.45 μM biotin–actin, fixed, and processed for immunostaining with 5 nm gold-conjugated antibiotin antibodies and rabbit anti-Arp3 or rabbit anti-p21 antibodies followed by 10 nm gold-conjugated anti–rabbit antibodies. Samples were processed for FDS (A) or negatively stained with 1% phosphotungstic acid and the distribution of the particles was analyzed in NIH Image (B) as described in Fig. 5 D. A shows the Arp2/3 complex localizing at the leading edge of filament intersections and along the side of individual filaments (frame 1, stereo view). Frames 2–4 show examples of localization of Arp2/3 complex at the vertices of actin filaments (arrowheads) or along the side of the filaments (star). Images shown are from the leading edge of a cell 1 min after stimulation: large (−10 nm gold) particles, p21 distribution (examples shown at large arrowheads), small (−5 nm gold) particles, and biotin–actin distribution (small arrows). Bright patches are vertical filaments containing biotin–actin gold particles that are not resolved in this axis of rotation. (B) Comparative distribution of Arp2/3 complex and free barbed ends at the leading edge. Both 5 nm and 10 nm gold particle distributions were recorded on the same samples, with the same reference towards the membrane. EGF0, unstimulated cells; EGF1, cells stimulated for 1 min with EGF; EGF3, cells stimulated for 3 min with EGF. The vertical bar marks the position of the membrane. The data were from one experiment for each Arp2/3 subunit in which 5–10 cells were analyzed for each time point. Only one representative distribution is shown for biotin–actin (which corresponds to the Arp3 data set), since the two distributions from the two sets of data (with Arp3 or p21) were identical. Bars, A, frame 1, 0.1 μm; A, frames 2–4, 0.05 μm.
Figure 9
Figure 9
Arp3 and p21 are recruited to the leading edge after stimulation. Cells were permeabilized in the presence of 0.45 μM biotin–actin, fixed, and processed for immunostaining with 5 nm gold-conjugated antibiotin antibodies and rabbit anti-Arp3 or rabbit anti-p21 antibodies followed by 10 nm gold-conjugated anti–rabbit antibodies. Samples were processed for FDS (A) or negatively stained with 1% phosphotungstic acid and the distribution of the particles was analyzed in NIH Image (B) as described in Fig. 5 D. A shows the Arp2/3 complex localizing at the leading edge of filament intersections and along the side of individual filaments (frame 1, stereo view). Frames 2–4 show examples of localization of Arp2/3 complex at the vertices of actin filaments (arrowheads) or along the side of the filaments (star). Images shown are from the leading edge of a cell 1 min after stimulation: large (−10 nm gold) particles, p21 distribution (examples shown at large arrowheads), small (−5 nm gold) particles, and biotin–actin distribution (small arrows). Bright patches are vertical filaments containing biotin–actin gold particles that are not resolved in this axis of rotation. (B) Comparative distribution of Arp2/3 complex and free barbed ends at the leading edge. Both 5 nm and 10 nm gold particle distributions were recorded on the same samples, with the same reference towards the membrane. EGF0, unstimulated cells; EGF1, cells stimulated for 1 min with EGF; EGF3, cells stimulated for 3 min with EGF. The vertical bar marks the position of the membrane. The data were from one experiment for each Arp2/3 subunit in which 5–10 cells were analyzed for each time point. Only one representative distribution is shown for biotin–actin (which corresponds to the Arp3 data set), since the two distributions from the two sets of data (with Arp3 or p21) were identical. Bars, A, frame 1, 0.1 μm; A, frames 2–4, 0.05 μm.
Figure 8
Figure 8
Filament length distribution within a 1-μm zone at the leading edge. Filament length was measured on samples processed for FDS using NIH Image (see Materials and Methods and Table I). The data correspond to data set #1 in Table I. (A) Cell edges not organized as typical leading edges in resting cells are shown (Fig. 7 B). (B) Leading edges in resting cells are shown. (C) Leading edges in cells stimulated with EGF for 1 min (Fig. 7 C) and (D) leading edges in cells stimulated with EGF for 3 min are shown.
Figure 10
Figure 10
Colocalization of Arp3 and gelsolin-capped actin barbed ends at the leading edge. Cells were permeabilized in presence of 100 nM b-GA2 (GA2), fixed, and processed for immunostaining as in Fig. 9. Samples were negatively stained with 1% phosphotungstic acid. Squares represent unstimulated cells and circles represent cells stimulated with EGF for 1 min. The vertical bar marks the position of the membrane. The top frames show barbed end (GA2) distribution and the bottom frames show matching Arp subunit distribution (left, Arp3; right, p21). The data for the Arp3 set are pooled from three experiments with a total of 28 and 29 cells for EGF0 and EGF1, respectively. The data from the p21 set are from one experiment with a total of 9 and 10 cells for EGF0 and EGF1, respectively.
Figure 1
Figure 1
Arp2/3 complex colocalizes with F-actin at the leading edge of cells after stimulation. Cells were stimulated with EGF for 3 min, fixed, permeabilized, and immunostained for Arp2/3 and actin. (A) Both Arp3 and p21 localize in the actin-rich zone at the extreme periphery of the cells (matching arrowheads). Frames 1 and 3, actin; frame 2, Arp3; and frame 4, p21. The box indicates the size of the region at the leading edge where all further analyses were done, including electron microscopy. In cells stimulated with a uniform upshift of EGF, the entire periphery of the cell becomes a lamellipod, the leading edge of which is identical to the leading edge of a polarized cell (Segall et al., 1996; Bailly et al., 1998; Chan et al., 1998). Therefore, the box could be positioned at random sites on the periphery of a stimulated cell. (B) Quantitation of immunofluorescence showing colocalization of Arp2/3 and actin within 1.5 μm at the leading edge. The fluorescence intensity graphed is the mean of the entire cell perimeter for 1-pixel-wide steps (see Materials and Methods). Gray diamonds represent actin; circles, Arp3; and squares represent p21. Both Arp2/3 (Arp3 and p21) and actin concentrations peak within 0.5 μm of the leading edge. The increase in fluorescence intensity that is observed further back from the membrane occurs because of interference from stress fibers for the actin and dense particles for Arp3 and p21, which emphasizes the need to use electron microscopy in this analysis. Bar, 10 μm.
Figure 1
Figure 1
Arp2/3 complex colocalizes with F-actin at the leading edge of cells after stimulation. Cells were stimulated with EGF for 3 min, fixed, permeabilized, and immunostained for Arp2/3 and actin. (A) Both Arp3 and p21 localize in the actin-rich zone at the extreme periphery of the cells (matching arrowheads). Frames 1 and 3, actin; frame 2, Arp3; and frame 4, p21. The box indicates the size of the region at the leading edge where all further analyses were done, including electron microscopy. In cells stimulated with a uniform upshift of EGF, the entire periphery of the cell becomes a lamellipod, the leading edge of which is identical to the leading edge of a polarized cell (Segall et al., 1996; Bailly et al., 1998; Chan et al., 1998). Therefore, the box could be positioned at random sites on the periphery of a stimulated cell. (B) Quantitation of immunofluorescence showing colocalization of Arp2/3 and actin within 1.5 μm at the leading edge. The fluorescence intensity graphed is the mean of the entire cell perimeter for 1-pixel-wide steps (see Materials and Methods). Gray diamonds represent actin; circles, Arp3; and squares represent p21. Both Arp2/3 (Arp3 and p21) and actin concentrations peak within 0.5 μm of the leading edge. The increase in fluorescence intensity that is observed further back from the membrane occurs because of interference from stress fibers for the actin and dense particles for Arp3 and p21, which emphasizes the need to use electron microscopy in this analysis. Bar, 10 μm.
Figure 3
Figure 3
Arp2/3 complex colocalizes with EGF-stimulated nucleation activity at the leading edge of the cells. Cells were stimulated with EGF and permeabilized in the presence of 0.45 μM rhodamine-labeled actin for 1 min, fixed, and stained for Arp2/3 localization. In unstimulated cells (EGF0), Arp3 is enriched in the peripheral submembraneous compartment, in conjunction with nucleation activity, and in ruffling areas (asterisk). 1 min after EGF stimulation (EGF1), Arp3 is recruited homogeneously to the extreme edge of the cells in conjunction with the newly created nucleation sites (arrowheads), as well as in particulate bodies (arrows). After 3 min (EGF3), nucleation activity remains confined to the very submembraneous compartment and the tips of the stress fibers (presumably focal contacts), whereas the Arp3 distribution is restricted to the leading edge where it tends to extend beyond the nucleation site location, further inside the cell (concave arrowheads). Bar, 20 μm.
Figure 2
Figure 2
Kinetics of appearance of nucleation sites at the leading edge after EGF stimulation. Cells were stimulated with EGF and permeabilized for 1 min in the presence of 0.45 μm rhodamine- actin. Nucleation activity was measured as rhodamine–actin incorporation within 1.1 μm of the circumferential membrane at the leading edge of the cells (Fig. 1 A, boxed area, and Materials and Methods). Results are the mean of three different experiments, with a total of 10–20 cells measured in each experiment.
Figure 11
Figure 11
Model of generation of nucleation sites at the leading edge after stimulation: cooperation of Arp2/3 complex and a cofilin-like severing activity. Numbers above arrows show the rate constants for each reaction (events/s), calculated from the molar on-rate constants presented in Mullins et al. (1998) and assuming a G-actin concentration of 1 μM. Longer arrows show preferred direction for the reactions. The rate constant of assembly of actin monomers into a dimer virtually precludes spontaneous generation of actin dimers in vivo (dotted line). Similarly, the formation of a complex between Arp2/3 and one actin monomer and the addition of a second actin monomer to this complex to create a nucleus is extremely unlikely. We propose that EGF stimulation triggers a signal that transiently and locally turns on cofilin activity at the leading edge. Activated cofilin severs preexisting filaments, generating small actin oligomers free both at their pointed ends and barbed ends (n designates two or more subunits). The oligomers are captured and stabilized by capping of pointed ends by the Arp2/3 complex to efficiently generate nucleation sites for actin polymerization. These stable nuclei can then polymerize very rapidly until their barbed ends are capped by capping protein (not shown).

References

    1. Abercrombie M, Heaysman JE, Pegrum SM. The locomotion of fibroblasts in culture. I. Movements of the leading edge. Exp Cell Res. 1970;59:393–398. - PubMed
    1. Aizawa H, Fukui Y, Yahara I. Live dynamics of Dictyosteliumcofilin suggests a role in remodeling actin latticework into bundles. J Cell Sci. 1997;110:2333–2344. - PubMed
    1. Arber S, Barbayannis F, Hanser H, Schneider C, Stanyon CA, Bernard O, Caroni P. Regulation of actin dynamics through phosphorylation of cofilin by LIM-kinase. Nature. 1988;393:805–809. - PubMed
    1. Bailly M, Yan L, Whitesides GM, Condeelis JS, Segall JE. Regulation of protrusion shape and adhesion to the substratum during chemotactic responses of mammalian carcinoma cells. Exp Cell Res. 1998;241:285–299. - PubMed
    1. Cano M, Lauffenburger D, Zigmond S. Kinetic analysis of F-actin depolymerization in polymorphonuclear leukocyte lysates indicates that chemoattractant stimulation increases actin filament number without altering the filament length distribution. J Cell Biol. 1991;115:677–687. - PMC - PubMed

Publication types