. 1999 Apr 19;189(8):1343-54.
doi: 10.1084/jem.189.8.1343.

Monocyte-mediated tumoricidal activity via the tumor necrosis factor-related cytokine, TRAIL

Affiliations

Monocyte-mediated tumoricidal activity via the tumor necrosis factor-related cytokine, TRAIL

T S Griffith et al. J Exp Med. .

Abstract

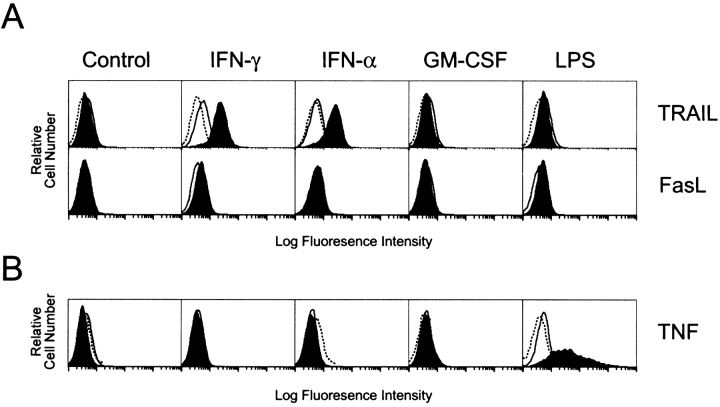
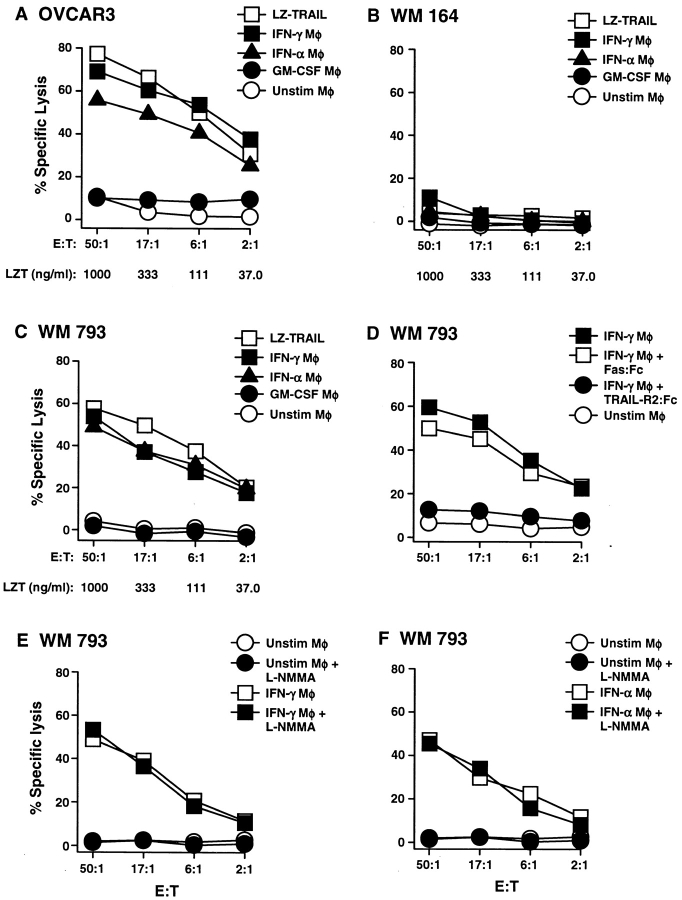
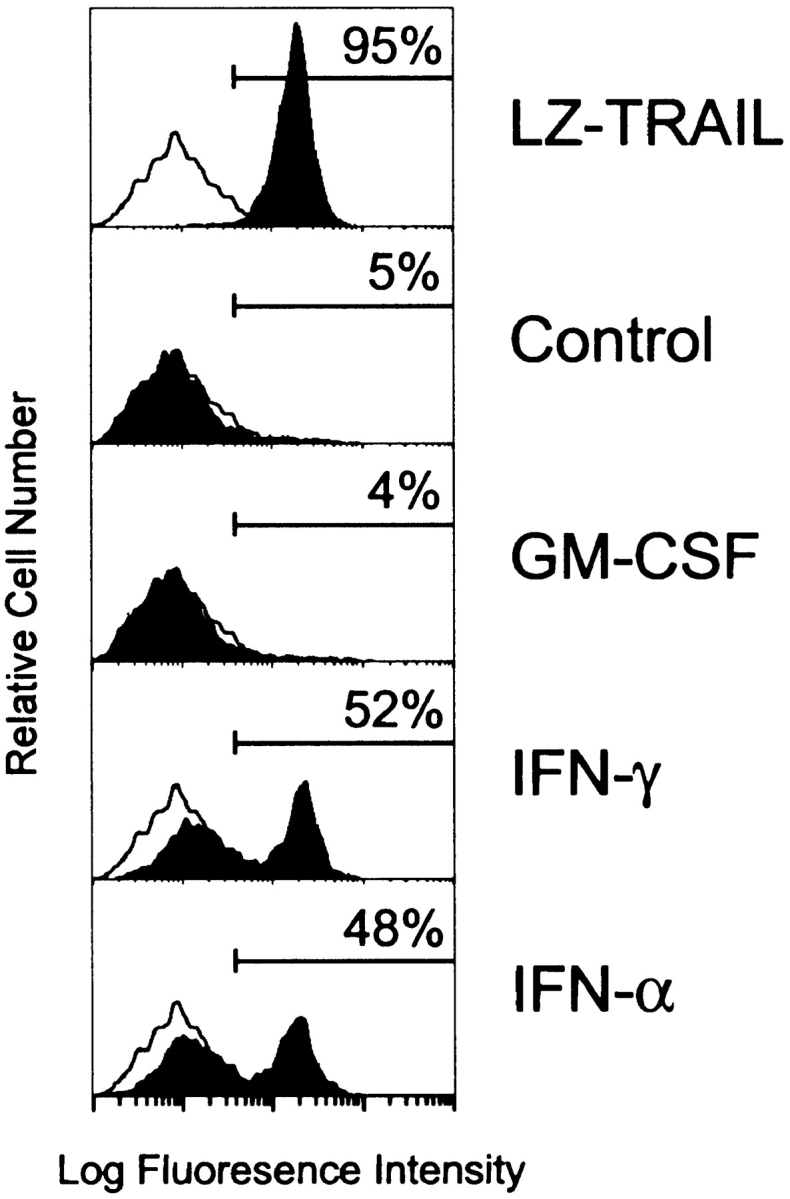
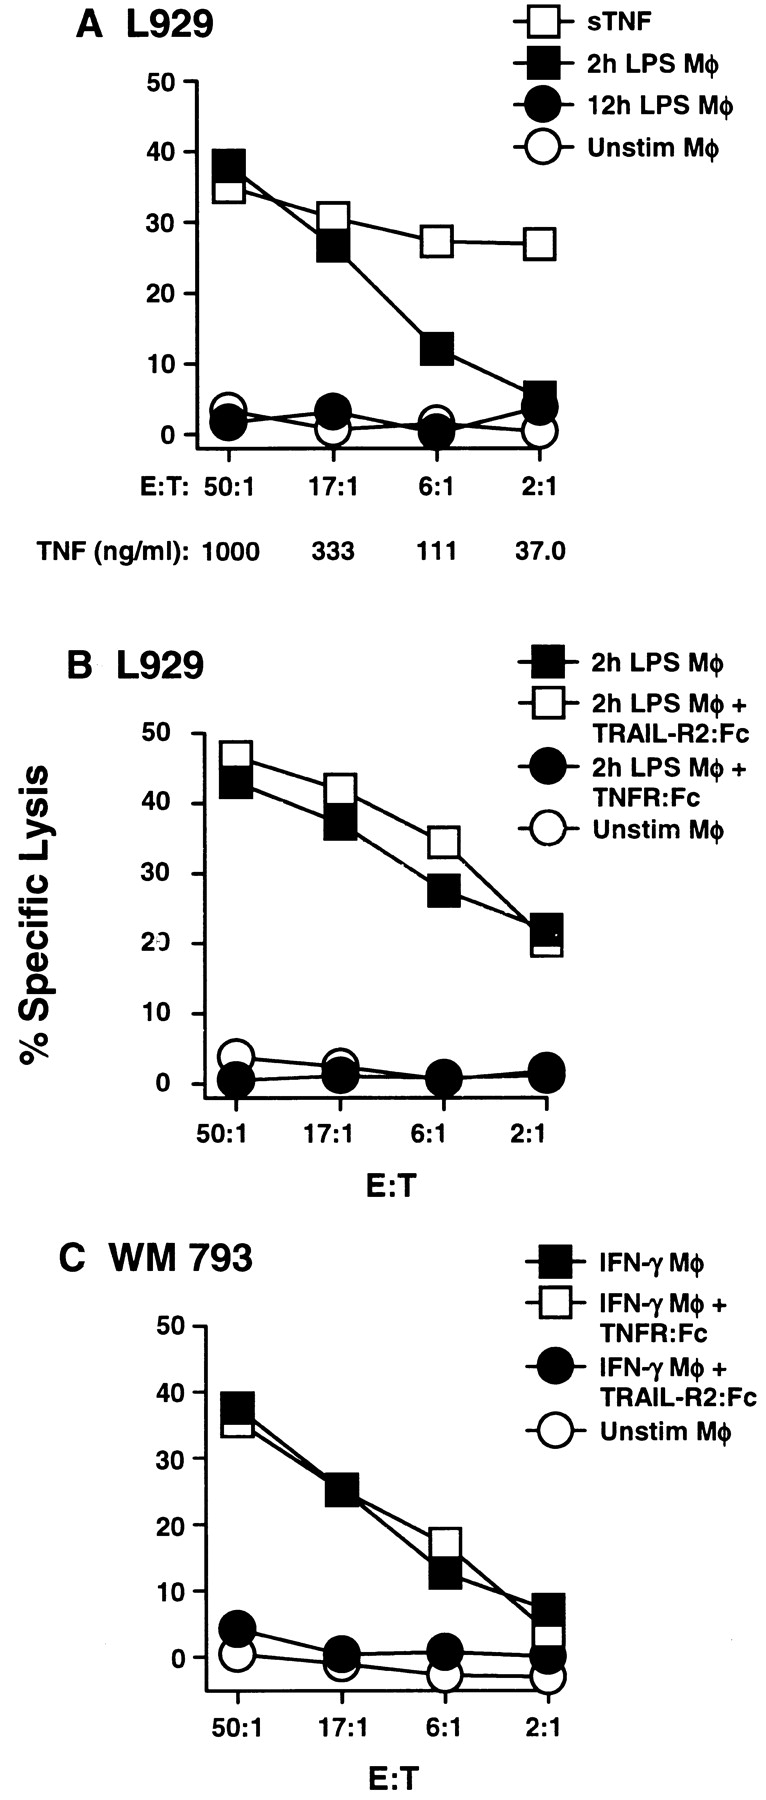
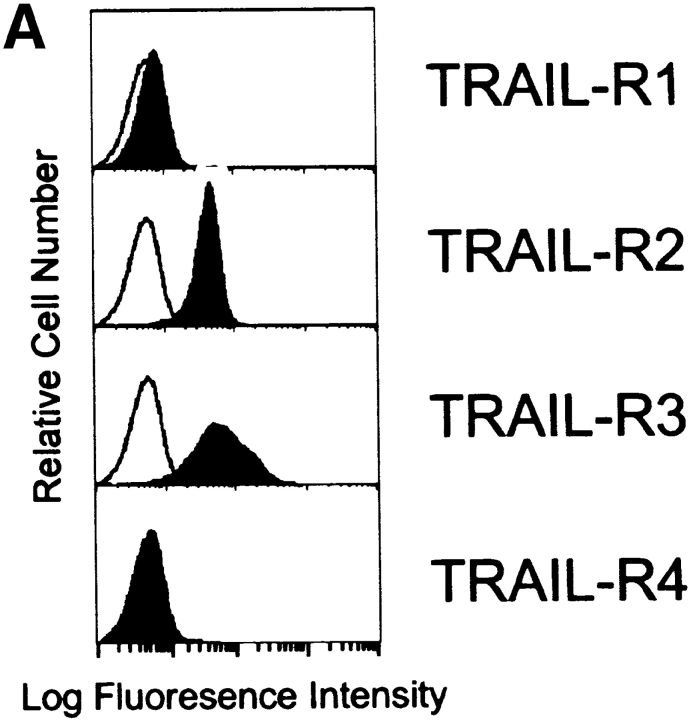
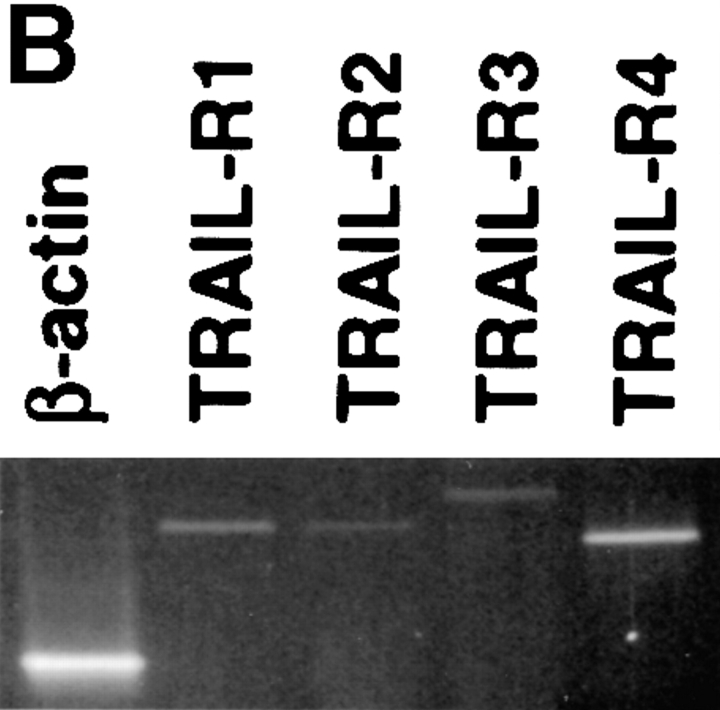
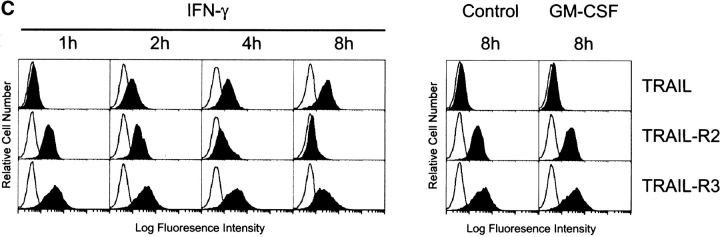
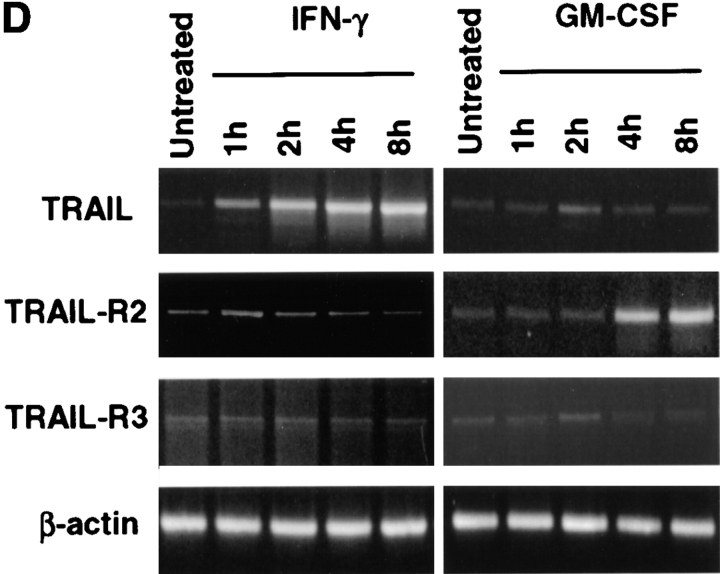
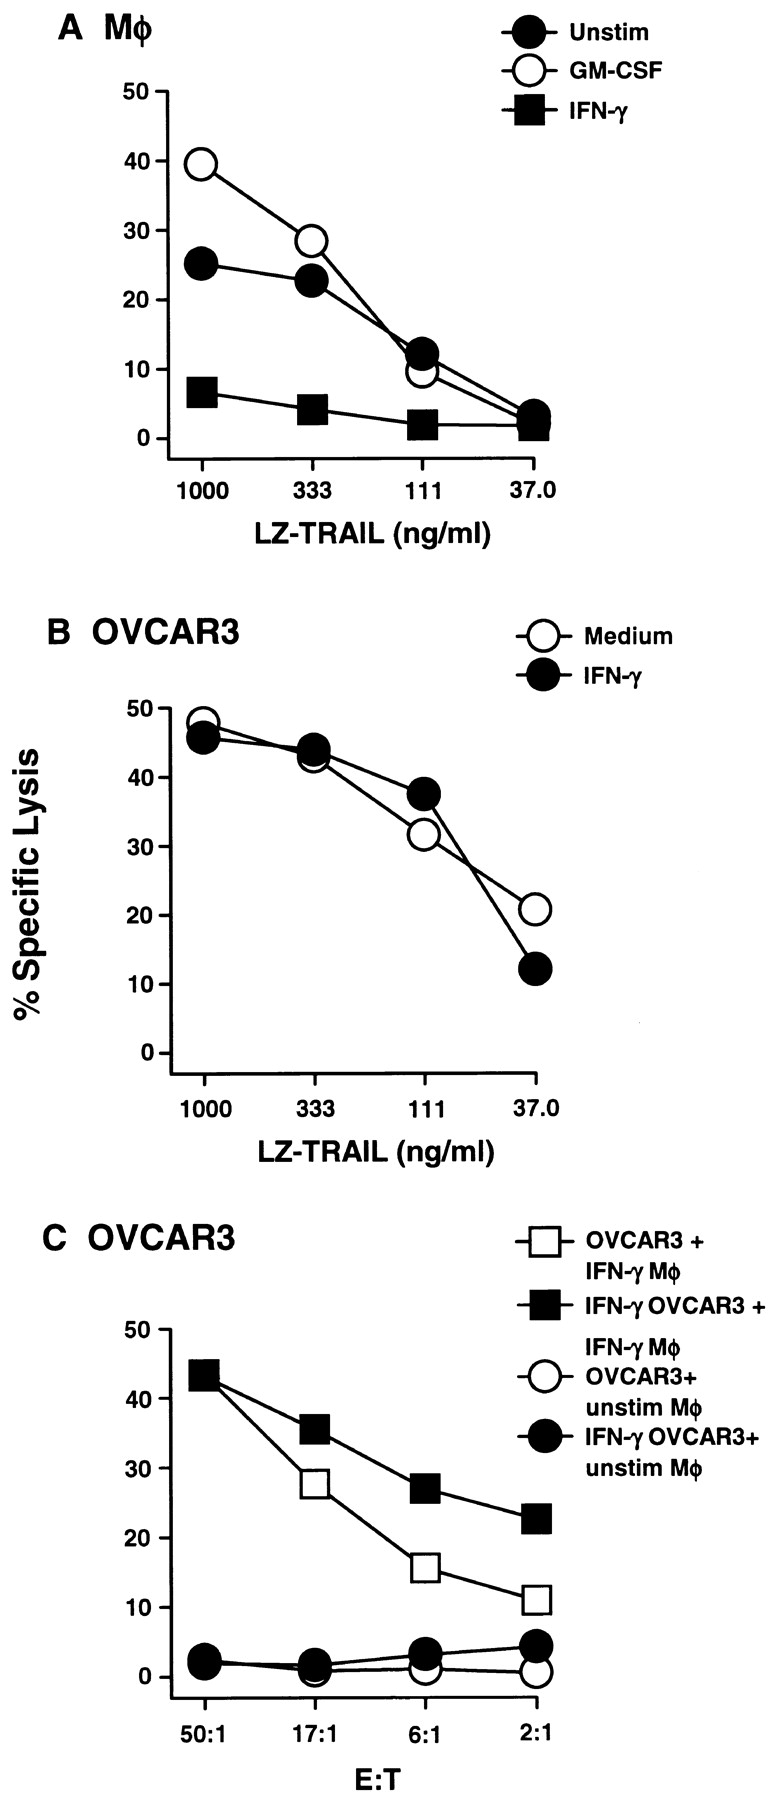
TRAIL (tumor necrosis factor [TNF]-related apoptosis-inducing ligand) is a molecule that displays potent antitumor activity against selected targets. The results presented here demonstrate that human monocytes rapidly express TRAIL, but not Fas ligand or TNF, after activation with interferon (IFN)-gamma or -alpha and acquire the ability to kill tumor cells. Monocyte-mediated tumor cell apoptosis was TRAIL specific, as it could be inhibited with soluble TRAIL receptor. Moreover, IFN stimulation caused a concomitant loss of TRAIL receptor 2 expression, which coincides with monocyte acquisition of resistance to TRAIL-mediated apoptosis. These results define a novel mechanism of monocyte-induced cell cytotoxicity that requires TRAIL, and suggest that TRAIL is a key effector molecule in antitumor activity in vivo.


Figures

Figure 1
Figure 1
TRAIL, FasL, and TNF expression on human Mφ. (A) Mφ were incubated for 2 or 12 h in the absence or presence of IFN-γ, IFN-α, GM-CSF, or LPS and then analyzed for TRAIL or FasL surface expression. Filled histograms represent staining at 12 h by either M181 (anti-TRAIL mAb) or NOK-1 (anti-FasL mAb). Open histograms represent staining at 2 h with the same mAb, whereas dotted histograms represent staining with isotype control mAb. (B) Mφ were incubated as in A and then analyzed for TNF surface expression. Filled histograms represent staining at 2 h by mAb11 (anti-TNF mAb). Open histograms represent staining at 12 h with the same mAb, whereas dotted histograms represent staining with isotype control mAb. Histograms represent 104 gated Mφ in all conditions, and viability was >95% as assessed by propidium iodide exclusion. These observations were reproduced using Mφ from at least five different donors.
Figure 2
Figure 2
TRAIL-mediated tumoricidal activity by human Mφ occurs after stimulation with IFN. (A–D) Mφ were incubated for 12 h in the absence or presence of either GM-CSF, IFN-γ, or IFN-α and then cultured for 8 h with 51Cr-labeled (A) OVCAR3, (B) WM 164, or (C) WM 793 target cells at the indicated E/T ratios. As a positive control, soluble LZ-TRAIL (LZT) was added to target cells at the indicated concentrations. (D) Inclusion of the fusion protein TRAIL-R2:Fc (20 μg/ml) to 12-h IFN-γ–stimulated Mφ inhibited killing of WM 793 target cells, whereas addition of Fas:Fc (20 μg/ml) did not. (E and F) Addition of the NO inhibitor L-NMMA (300 μM) did not alter the antitumor activity of (E) IFN-γ– or (F) IFN-α–stimulated Mφ against WM 793 target cells. Data points represent the mean of triplicate wells, and experiments were repeated at least three times with similar results. For clarity, SD bars were omitted from the graphs, but were <10% of the value of all points.
Figure 3
Figure 3
Phosphatidylserine externalization on OVCAR3 tumor cells during apoptosis induced by IFN-stimulated, TRAIL- expressing Mφ. OVCAR3 tumor cells were cultured for 6 h in medium alone or in the presence of LZ-TRAIL (1 μg/ml), unstimulated, or cytokine (GM-CSF, IFN-γ, IFN-α [100 ng/ml for 12 h])–stimulated Mφ (E/T ratio 2:1). Cells were then stained with FITC–annexin V and analyzed by flow cytometry. The percent of FITC–annexin V positive tumor cells is indicated for each condition. Histograms represent 104 gated tumor cells. Similar results were seen with Mφ from three other donors.
Figure 4
Figure 4
TNF-mediated apoptosis by human Mφ occurs after stimulation with LPS but not IFN-γ. (A) Mφ were incubated in the absence or presence of LPS for 2 or 12 h and then cultured for 8 h with 51Cr-labeled L929 target cells at the indicated E/T ratios. As a positive control, soluble (s)TNF was added to targets cells at the indicated concentrations. (B) Inclusion of TNFR: Fc (20 μg/ml) to 2-h LPS-stimulated Mφ inhibited the killing of L929 target cells, whereas addition of TRAIL-R2:Fc (20 μg/ml) did not. (C) Killing of WM 793 tumor cells by Mφ stimulated with IFN-γ for 12 h can be inhibited by TRAIL-R2:Fc (20 μg/ml), but not TNFR:Fc (20 μg/ml). Data points represent the mean of triplicate wells, and the experiments were repeated at least three times with similar results. For clarity, SD bars were omitted from the graphs, but were <10% of the value of all points.
Figure 5
Figure 5
Surface analysis of IFN-γ–stimulated Mφ reveals simultaneous increase in TRAIL expression with downregulation of TRAIL-R2 expression. (A) Flow cytometric analysis of TRAIL-R1, -R2, -R3, and -R4 expression on unstimulated Mφ. Filled histograms represent staining by M271 (anti–TRAIL-R1 mAb), M413 (anti–TRAIL-R2 mAb), M430 (anti–TRAIL-R3 mAb), or M444 (anti–TRAIL-R4 mAb), and open histograms represent staining with isotype control mAb. (B) RT-PCR analysis of TRAIL receptor mRNA expression in normal Mφ. (C) TRAIL, TRAIL-R2, and TRAIL-R3 expression after various times of IFN-γ stimulation. Filled histograms represent staining by M413 (anti–TRAIL-R2 mAb), M430 (anti–TRAIL-R3 mAb), or M181 (anti-TRAIL mAb), and open histograms represent staining with isotype control mAb. For comparison, Mφ cultured in the absence or presence of GM-CSF for 8 h were also stained for TRAIL, TRAIL-R2, and TRAIL-R3. (D) RT-PCR analysis of TRAIL, TRAIL-R2, and TRAIL-R3 mRNA levels after Mφ culture in the absence or presence of IFN-γ and GM-CSF. β-actin was used as a control over the same time course. Similar results were observed with Mφ from two other donors.
Figure 5
Figure 5
Surface analysis of IFN-γ–stimulated Mφ reveals simultaneous increase in TRAIL expression with downregulation of TRAIL-R2 expression. (A) Flow cytometric analysis of TRAIL-R1, -R2, -R3, and -R4 expression on unstimulated Mφ. Filled histograms represent staining by M271 (anti–TRAIL-R1 mAb), M413 (anti–TRAIL-R2 mAb), M430 (anti–TRAIL-R3 mAb), or M444 (anti–TRAIL-R4 mAb), and open histograms represent staining with isotype control mAb. (B) RT-PCR analysis of TRAIL receptor mRNA expression in normal Mφ. (C) TRAIL, TRAIL-R2, and TRAIL-R3 expression after various times of IFN-γ stimulation. Filled histograms represent staining by M413 (anti–TRAIL-R2 mAb), M430 (anti–TRAIL-R3 mAb), or M181 (anti-TRAIL mAb), and open histograms represent staining with isotype control mAb. For comparison, Mφ cultured in the absence or presence of GM-CSF for 8 h were also stained for TRAIL, TRAIL-R2, and TRAIL-R3. (D) RT-PCR analysis of TRAIL, TRAIL-R2, and TRAIL-R3 mRNA levels after Mφ culture in the absence or presence of IFN-γ and GM-CSF. β-actin was used as a control over the same time course. Similar results were observed with Mφ from two other donors.
Figure 6
Figure 6
IFN-γ stimulation renders Mφ resistant to TRAIL-induced death, but not tumor cell targets. (A) Peripheral blood Mφ were incubated for 12 h in the absence or presence of GM-CSF and IFN-γ, then tested for sensitivity to LZ-TRAIL. (B) OVCAR3 tumor cells were incubated for 12 h in the absence or presence of IFN-γ, then tested for sensitivity to LZ-TRAIL. (C) OVCAR3 tumor cells were cultured for 12 h in the absence or presence of IFN-γ, then incubated with unstimulated or IFN-γ–stimulated Mφ. Percent specific lysis was measured by 51Cr release after 8 h, and each data point represents the mean of triplicate wells. For clarity, SD bars were omitted from the graphs, but were <10% of the value of all points. These experiments were repeated at least three times with similar results using Mφ from at least three different donors.

References

    1. Adams DO, Hamilton TA. The cell biology of macrophage activation. Annu Rev Immunol. 1984;2:283–318. - PubMed
    1. Pfeifer JD, Wick MJ, Roberts RL, Findlay K, Normark SJ, Harding CV. Phagocytic processing of bacterial antigens for class I MHC presentation to T cells. Nature. 1993;361:359–362. - PubMed
    1. Gosselin EJ, Wardwell K, Gosselin DR, Alter N, Fisher JL, Guyre PM. Enhanced antigen presentation using human Fc gamma receptor (monocyte/macrophage)-specific immunogens. J Immunol. 1992;149:3477–3481. - PubMed
    1. Ding AH, Nathan CF, Stuehr DJ. Release of reactive nitrogen intermediates and reactive oxygen intermediates from mouse peritoneal macrophages. Comparison of activating cytokines and evidence for independent production. J Immunol. 1988;141:2407–2412. - PubMed
    1. Jewett A, Giori JV, Bonavida B. Antibody- dependent cellular cytotoxicity against HIV-coated target cells by peripheral blood monocytes from HIV seropositive asymptomatic patients. J Immunol. 1990;145:4065–4071. - PubMed

MeSH terms

Substances