

Quantitative assessment of macular thickness in normal subjects and patients with diabetic retinopathy by scanning retinal thickness analyser
- PMID: 10209436
- PMCID: PMC1722802
- DOI: 10.1136/bjo.83.1.54
Quantitative assessment of macular thickness in normal subjects and patients with diabetic retinopathy by scanning retinal thickness analyser
Abstract
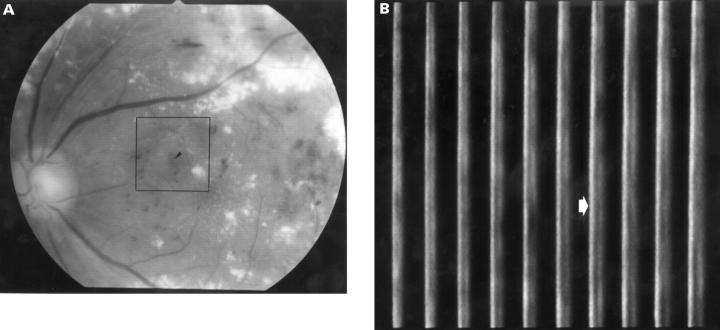
Aims: To evaluate the scanning retinal thickness analyser (RTA), a novel non-invasive imaging instrument, in diagnosing and quantitatively characterising diabetic macular oedema, and to investigate the relation between central macula thickness measured by RTA and other clinical examinations.
Methods: Central macular thickness was measured using the RTA in 40 normal subjects and 60 patients with diabetic retinopathy. The reproducibility of the retinal thickness measurements was evaluated by calculating the mean of the inter- and intrasession variations. Central macular thickness was correlated with the results of visual acuity measurements, biomicroscopy, and fluorescein angiography.
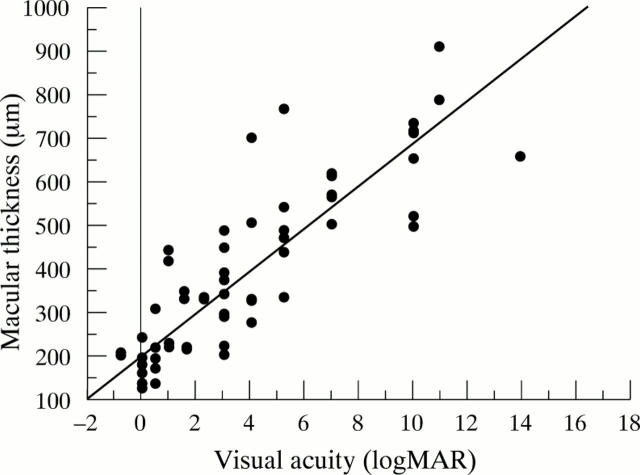
Results: Intra- and intersession reproducibility of the RTA in normal subjects was plus or minus 5.2% (16 microns) and plus or minus 6.1% (19 microns), respectively. The mean central macular thickness was 182 (SD 16) microns in normal subjects, 283 (116) microns in diabetic eyes without clinically significant macular oedema (CSMO), and 564 (168) microns in diabetic eyes with CSMO. Central macular thickness was significantly greater (p < 0.001) in eyes with diabetic retinopathy than in normal subjects, even when macular thickening did not meet the standard for CSMO (p = 0.019) measured by biomicroscopy. Although greater fluorescein leakage at the macula results in greater central macular thickness, only eyes with diffuse leakage had statistically significant macular thickening compared with normal subjects (p = 0.022). Central macular thickness measured with the RTA was significantly correlated with the logarithmic converted visual acuity (r2 = 0.76) in diabetic eyes.
Conclusion: Scanning RTA, which has good reproducibility, might be useful to quantitatively detect and monitor macular thickening in diabetic retinopathy. Central macular thickness was highly correlated with logarithmic converted visual acuity in diabetic macular oedema.
Figures


Similar articles
-
Retinal thickness variation in the diabetic patient measured by the retinal thickness analyser.Br J Ophthalmol. 1998 Sep;82(9):1003-6. doi: 10.1136/bjo.82.9.1003. Br J Ophthalmol. 1998. PMID: 9893588 Free PMC article.
-
Topography of diabetic macular edema with optical coherence tomography.Ophthalmology. 1998 Feb;105(2):360-70. doi: 10.1016/s0161-6420(98)93601-6. Ophthalmology. 1998. PMID: 9479300 Free PMC article.
-
Topography of diabetic macular oedema compared with fluorescein angiography.Acta Ophthalmol Scand. 2007 Feb;85(1):32-9. doi: 10.1111/j.1600-0420.2006.00727.x. Acta Ophthalmol Scand. 2007. PMID: 17244207
-
The correlation between optical coherence tomographic features and severity of retinopathy, macular thickness and visual acuity in diabetic macular edema.Int Ophthalmol. 2005 Jun;26(3):93-9. doi: 10.1007/s10792-006-9007-8. Epub 2006 Oct 25. Int Ophthalmol. 2005. PMID: 17063373
-
Diabetic macular edema.Eur J Ophthalmol. 1998 Jul-Sep;8(3):127-30. doi: 10.1177/112067219800800301. Eur J Ophthalmol. 1998. PMID: 9793763 Review.
Cited by
-
Mapping of the retinal pigment epithelium in exudative age related macular degeneration.Graefes Arch Clin Exp Ophthalmol. 2006 Mar;244(3):342-51. doi: 10.1007/s00417-005-0056-x. Epub 2005 Aug 18. Graefes Arch Clin Exp Ophthalmol. 2006. PMID: 16133030
-
Zone-wise examination of optical coherence tomography features and their correspondence to multifocal electroretinography in eyes with nonproliferative diabetic retinopathy.Graefes Arch Clin Exp Ophthalmol. 2022 Mar;260(3):827-837. doi: 10.1007/s00417-021-05446-z. Epub 2021 Oct 18. Graefes Arch Clin Exp Ophthalmol. 2022. PMID: 34661732 Free PMC article.
-
Assessment of colour vision as a screening test for sight threatening diabetic retinopathy before loss of vision.Br J Ophthalmol. 2003 Jun;87(6):747-52. doi: 10.1136/bjo.87.6.747. Br J Ophthalmol. 2003. PMID: 12770974 Free PMC article.
-
Repeatability and reproducibility of optic nerve head topography using the retinal thickness analyzer.Graefes Arch Clin Exp Ophthalmol. 2006 Feb;244(2):192-8. doi: 10.1007/s00417-005-0027-2. Epub 2005 Aug 5. Graefes Arch Clin Exp Ophthalmol. 2006. PMID: 16082558
-
Cystoid macular edema.Clin Ophthalmol. 2008 Dec;2(4):919-30. doi: 10.2147/opth.s4033. Clin Ophthalmol. 2008. PMID: 19668445 Free PMC article.
References
MeSH terms
LinkOut - more resources
Full Text Sources
Medical