. 1999 May 1;19(9):3580-93.
doi: 10.1523/JNEUROSCI.19-09-03580.1999.

Retinal waves are governed by collective network properties

Affiliations

Retinal waves are governed by collective network properties

D A Butts et al. J Neurosci. .

Abstract

Propagating neural activity in the developing mammalian retina is required for the normal patterning of retinothalamic connections. This activity exhibits a complex spatiotemporal pattern of initiation, propagation, and termination. Here, we discuss the behavior of a model of the developing retina using a combination of simulation and analytic calculation. Our model produces spatially and temporally restricted waves without requiring inhibition, consistent with the early depolarizing action of neurotransmitters in the retina. We find that highly correlated, temporally regular, and spatially restricted activity occurs over a range of network parameters; this ensures that such spatiotemporal patterns can be produced robustly by immature neural networks in which synaptic transmission by individual neurons may be unreliable. Wider variation of these parameters, however, results in several different regimes of wave behavior. We also present evidence that wave properties are locally determined by a single variable, the fraction of recruitable (i.e., nonrefractory) cells within the dendritic field of a retinal neuron. From this perspective, a given local area's ability to support waves with a wide range of propagation velocities-as observed in experiment-reflects the variability in the local state of excitability of that area. This prediction is supported by whole-cell voltage-clamp recordings, which measure significant wave-to-wave variability in the amount of synaptic input a cell receives when it participates in a wave. This approach to describing the developing retina provides unique insight into how the organization of a neural circuit can lead to the generation of complex correlated activity patterns.


Figures
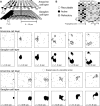
Fig. 1.
Fig. 1.
Schematic of the retinal model. A, The model consists of two overlapping cell layers, the amacrine cell layer and the ganglion cell layer, arranged in a hexagonal array. The lattice spacing of amacrine cells is given by a = 34 μm, and the lattice spacing of ganglion cells is one-half that value. An active amacrine cell stimulates neighboring amacrine cells and ganglion cells over a distance of R = 120 μm (connections are shown by dark lines). A representative state of the model is pictured, with active cells coloredblack, recruitable cells white, and refractory cells gray. As a result of the connectivity, a wave propagating in the amacrine cell layer (from theleft) only includes a fraction of the total number of amacrine cells, but the resulting wave in the ganglion cell layer is contiguous. B, The rules governing wave propagation in the amacrine cell layer are illustrated by picturing a representative state. A wave composed of active amacrine cells (black) is propagating from left to right. Refractory cells (gray with anX) are unable to participate. Recruitable cells (white) can become active by either being stimulated above threshold θ or becoming spontaneously active with probabilityp. An example recruitable cell (middle white circle with dark outline) will become active in the next time step if the number of active cells within its input radius (large dashed gray circle) exceeds the threshold θ. C, Twelve frames from the simulation picturing active amacrine cells (first and third rows) and active ganglion cells (second andfourth rows) at 0.5 sec intervals for two consecutive waves 49.3 sec apart are shown. Each frame corresponds to 1.9 mm × 1.6 mm of the retina; the size of a dendritic arbor at this scale is shown as a dashed circle.
Fig. 2.
Fig. 2.
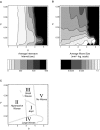
Behavior of the model over parameter space.A, The average interwave interval is shown as a function of model parameters p and θ. The interwave interval is a measure of the periodicity of wave activity through a given region of the retina. The full retinal simulation was run for 100 simulated minutes (n = 2) for each choice of parameter values; <10 waves occur for high threshold (θ > 4;black), and the average interwave interval is small (<30 sec between waves) for low threshold (θ < 2;white). B, Average domain size is shown as a function of model parameters p and θ. The average domain size was recorded from the same simulations shown inA, where again black represents regions where <10 waves occurred. Large waves (white) occur for small values of the spontaneous initiation rate p, and the average domain size gets smaller as p is raised.C, Data shown in A and Bis used to produce a phase diagram that distinguishes between qualitatively different regimes of wave behavior. (See Results for more details.) Video attachment, Five movies of the retinal stimulation, each representing a different point in parameter space, can be downloaded from http://marichal.berkeley.edu/jneuro. Movies show the state of the amacrine and ganglion cell layers over the course of 1 min, played in real time.
Fig. 3.
Fig. 3.
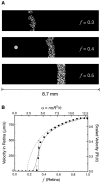
Wavefront velocity is governed by a single parameter. A, Simulation of the amacrine cell layer under restricted dynamics. The cell layer is started in a state with a randomly selected fraction f of cells assigned to be recruitable, and the remaining 1 − f fraction is assigned to be refractory for the duration of the simulation. Spontaneous activity is suppressed, and a wave is initiated att = 0 and allowed to propagate across the cell array. A snapshot of the state of the model after 9 sec forf = 0.3 (top), 0.4 (middle), and 0.5 (bottom) is shown with the active cells in white. Neurons stimulated above threshold are active for TF = 1 sec and then are inactive for the duration of the simulation. The gray circle shows the input radius of an individual cell.B, The wavefront velocity as a function off. Results from the simulation are shown asfilled circles, with error bars showing the variation in wavefront velocity from trial to trial. A numerical analysis of propagation velocity is shown as a dashed line, and a more detailed analytic treatment that takes into account fluctuations in the local value of f is shown as asolid line. Left axis, Velocity is scaled for values relevant to the developing retina. Right axis, Velocity is normalized byRt (see Results). Bottom axis, f, the fraction of recruitable (i.e., participating) cells, is varied. Top axis, The corresponding value of the dimensionless variable α (the ratio of the number of inputs from participating cells to the threshold) is shown.
Fig. 4.
Fig. 4.
The mesoscopic variablef(r,t) governs wave evolution.A, The state of cells in the simulation over an array of 48 × 48 neurons just before a wave initiation. The white circles indicate recruitable cells; the black circles are refractory cells. The large circlewith an X corresponds to the initiation point of the wave; the gray circle in the bottom rightis a typical dendritic arbor (∼42 cells). B, Contours representing the simulated wavefront at 0.5 sec intervals, where the wave boundary is shown as a thick line. Note that wave propagation is not uniform in the simulated retina and reaches thetop boundary in 1.5 sec and the bottom right boundary after 4 sec. Where the wave stalls, many contours overlap, also producing a thick line.C, The fraction of recruitable cellsf(r,t0) before wave initiation. This coarse-grained measure of the state of the retina is calculated from the cellular information in A, with grayscale values distinguishing between low f(dark) and higher f(white). Wave initiation occurs close to the maximum value shown (f = 0.28), and the boundary of the wavefront occurs aroundf(r,t0) ∼ 0.18. D, The predicted wave evolution using the coarse-grained measuref(r,t0). An analytic model using only the coarse-grained information inC and the initiation position is used to predict wave evolution, with contours again representing the wavefront at 0.5 sec intervals. The overall propagation time and the rough shape of the evolution are close to that found in the simulation, although details on a scale less than R are incorrect. Shaded areas show where coarse-graining errors on the boundary lead to the incorrect prediction of further propagation.
Fig. 5.
Fig. 5.
The time evolution off(r,t) in a typical region of the simulated retina. A, The fraction of recruitable cells in an input arbor fluctuates over time, as measured over 8 min of simulation time (4 × TR). The times when wave activity occurred are labeled with a dark vertical bar; a star indicates the wave initiated in the region. The solid horizontal line showsf*, such that the region is unable to support wave activity for f < f* (shaded areas). The dashed horizontal line shows the predicted equilibrium value of fin the absence of wave activity, f¯B, A histogram of the values of f over a 100 min simulation is shown. The value of f in a given region was recorded at each time step (0.1 sec) over a 100 min simulation and analyzed. Although distributed over a range from 0 to 0.5, f is most frequently around the equilibrium value f¯(thick dashed line) and the lower limit for propagation to be possible f* (thin solid line).
Fig. 6.
Fig. 6.
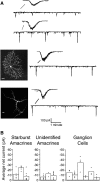
Periodic compound PSCs measured in several cell types from P0 to P2 rabbit retina show a similar time course but receive a varying amount of synaptic input from wave to wave.A, Continuous whole-cell voltage-clamp recordings of 5 min with an expansion of 5 sec surrounding a compound PSCabove each trace are shown. Ganglion cells (top two traces) were determined by soma size; cholinergic amacrine cells (middle trace) and unidentified amacrine cells (bottom trace) were determined by soma size and morphology. Inset, A projection of a confocal image of a Lucifer yellow-filled cell corresponding to the recordings is shown. Scale bars, 25 μm.B, Each column refers to a different cell. The average net current was computed by averaging the individual PSCs over a 5 sec window and subtracting the baseline current recorded from the 5 sec preceding the PSC.

References

    1. Borges S, Gleason E, Frerking M, Wilson M. Neurotensin induces calcium oscillations in cultured neurons. Vis Neurosci. 1996;13:311–318. - PubMed
    1. Burgi PY, Grzywacz NM. Model for the pharmacological basis of spontaneous synchronous activity in developing retinas. J Neurosci. 1994;14:7426–7439. - PMC - PubMed
    1. Catsicas M, Bonness V, Becker D, Mobbs P. Spontaneous Ca2+ transients and their transmission in the developing chick retina. Curr Biol. 1998;8:283–286. - PubMed
    1. Copenhagen DR. Retinal development: on the crest of an exciting wave. Curr Biol. 1996;6:1368–1370. - PubMed
    1. Feller MB, Wellis DP, Stellwagen D, Werblin FS, Shatz CJ. Requirement for cholinergic synaptic transmission in the propagation of spontaneous retinal waves. Science. 1996;272:1182–1187. - PubMed

Publication types

Substances

LinkOut - more resources