. 1999 May 3;407(2):151-65.

Development and organization of ocular dominance bands in primary visual cortex of the sable ferret

Affiliations

Development and organization of ocular dominance bands in primary visual cortex of the sable ferret

E S Ruthazer et al. J Comp Neurol. .

Abstract

Thalamocortical afferents in the visual cortex of the adult sable ferret are segregated into eye-specific ocular dominance bands. The development of ocular dominance bands was studied by transneuronal labeling of the visual cortices of ferret kits between the ages of postnatal day 28 (P28) and P81 after intravitreous injections of either tritiated proline or wheat germ agglutinin-horseradish peroxidase. Laminar specificity was evident in the youngest animals studied and was similar to that in the adult by P50. In P28 and P30 ferret kits, no modulation reminiscent of ocular dominance bands was detectable in the pattern of labeling along layer IV. By P37 a slight fluctuation in the density of labeling in layer IV was evident in serial reconstructions. By P50, the amplitude of modulation had increased considerably but the pattern of ocular dominance bands did not yet appear mature. The pattern and degree of modulation of the ocular dominance bands resembled that in adult animals by P63. Flat mounts of cortex and serial reconstructions of layer IV revealed an unusual arrangement of inputs serving the two eyes in the region rostral to the periodic ocular dominance bands. In this region, inputs serving the contralateral eye were commonly fused along a mediolateral axis, rostral to which were large and sometimes fused patches of ipsilateral input.


Figures

Fig. 1
Fig. 1
Mature laminar distribution of transneuronal label. Autoradiographic label forms a prominent band in layer IV and falls to near background levels in the upper part of layer II/III. Intermediate labeling is evident in layer VI. A Nissl-stained adjacent section (left) and the autoradiographic section (ARG) from which the silver grain counts were made (middle) are included for reference. Measurements were made in the monocular segment of area 17 contralateral to the injected eye of a P81 ferret. Density is given in silver grains per 1,000 μm2. The thick curve is the mean sliver grain density averaged across a distance of 108 μm (nine bins of 12 × 80 μm). The dashed line indicates background silver grain counts, measured in auditory cortex. WM, white matter.
Fig. 2
Fig. 2
Laminar distribution of transneuronal label during development. At all ages studied (postnatal day [P] 28, P37, P50, P63), labeling is greatest in layer IV, but the density of label within layer IV relative to the surrounding layers increases gradually with age and achieves a qualitatively mature distribution by P50. Label density is near background levels in upper layer II/III at all ages, consistent with a selective increase in layer IV label during development, rather than exuberance and pruning. There is also a slight increase in the thickness of the visual cortex between P28 and P37. Conventions are the same as in Figure 1.
Fig. 3
Fig. 3
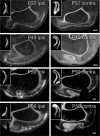
Developmental series showing ocular dominance bands in single sections. The development of ocular dominance bands is demonstrated in autoradiographic sections cut in a plane slightly off horizontal (see text) in ferret kits perfused at postnatal day (P)37, P45, P50, P56, P63, P74, and P81. For each age, hemispheres ipsilateral to the injected eye are displayed on the left and contralateral hemispheres on the right. Because of the sharp curvature of the ferret occipital cortex, this plane of section occasionally cuts nearly tangentially through part of layer IV in sections near the occipitotemporal sulcus. As early as P37, a faint modulation is detectable in both hemispheres, although it is clearer in the hemisphere ipsilateral to the injected eye. This fluctuation in labeling becomes sharper with age and appears adult-like by P63. In the medial part of most sections, there is a transition from a long contralateral eye band to a long, and slightly more radially diffuse, ipsilateral eye band near the presumed area 17/18 transition zone. Autoradiographs of parasagittal sections of the corresponding LGNs (insets) reveal normal eye-specific lamination, including occasional “bridges” in the C laminae. Lateral is left and anterior is up in cortical sections. Anterior is left and dorsal is up in thalamic sections. Scale bars = 1mm (applies to both hemispheres and to the LGNs at each age).
Fig. 3
Fig. 3
Developmental series showing ocular dominance bands in single sections. The development of ocular dominance bands is demonstrated in autoradiographic sections cut in a plane slightly off horizontal (see text) in ferret kits perfused at postnatal day (P)37, P45, P50, P56, P63, P74, and P81. For each age, hemispheres ipsilateral to the injected eye are displayed on the left and contralateral hemispheres on the right. Because of the sharp curvature of the ferret occipital cortex, this plane of section occasionally cuts nearly tangentially through part of layer IV in sections near the occipitotemporal sulcus. As early as P37, a faint modulation is detectable in both hemispheres, although it is clearer in the hemisphere ipsilateral to the injected eye. This fluctuation in labeling becomes sharper with age and appears adult-like by P63. In the medial part of most sections, there is a transition from a long contralateral eye band to a long, and slightly more radially diffuse, ipsilateral eye band near the presumed area 17/18 transition zone. Autoradiographs of parasagittal sections of the corresponding LGNs (insets) reveal normal eye-specific lamination, including occasional “bridges” in the C laminae. Lateral is left and anterior is up in cortical sections. Anterior is left and dorsal is up in thalamic sections. Scale bars = 1mm (applies to both hemispheres and to the LGNs at each age).
Fig. 4
Fig. 4
Transneuronal autoradiographic labeling in postnatal day (P)30 visual cortex. Photomontages from tangential sections of unfolded visual cortex, ipsilateral (A) and contralateral (B) to the injected eye, from a ferret injected on P23 and killed on P30. There is no obvious fluctuation resembling ocular dominance bands in the patterns in either hemisphere at this age. L, lateral; A, anterior. Scale bar = 5 mm in B (applies to A,B).
Fig. 5
Fig. 5
Development of modulation in the eye-specific pattern of transneuronal label. Silver grain counts along layer IV in the binocular regions of area 17 from transneuronal autoradiographs are plotted for both hemispheres at various ages. At postnatal day (P)30, a modulation in the pattern of labeling is not evident. By P37, a faint fluctuation is detectable. The amplitude of this modulation increases by P50 but appears to be restricted to small patches in the ipsilateral hemisphere. The crisp, almost square wave pattern of label in the P63 and P81 ferrets indicates that a high degree of segregation is present at these ages. Conventions are the same as in Figure 1.
Fig. 6
Fig. 6
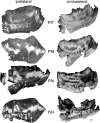
Pattern of ocular dominance bands during development. Photomontages of the binocular part of visual cortex from aligned serial autoradiographic sections reveal the overall pattern of ocular dominance bands in ferret visual cortex. Within caudal area 17, eye-specific labeling has a patchy, banded appearance, reminiscent of cat ocular dominance bands, but more strongly contralaterally biased. Near the presumed transition zone between areas 17 and 18, this pattern is interrupted by broad monocular strips that run approximately mediolaterally. This pattern is especially evident in the medial parts of the reconstructions and is present at all ages when ocular dominance bands are detectable. There appears to be a progressive expansion of the ipsilateral eye bands in the caudal part of area 17 from postnatal day (P)50 to P63. Left is lateral and up is anterior. Scale bar = 1 mm.
Fig. 7
Fig. 7
Adult pattern of ocular dominance bands. Photomontages of tetramethyl benzidine-processed flatmounts of ipsilateral (A) and contralateral (B) visual cortices, labeled transneuronally by monocular injections of wheat germ agglutinin-horseradish peroxidase. In these montages, the tendency of patchy bands in area 17 to line up into rostrocaudally running strips can be seen clearly in the medial parts of the binocular segments in both hemispheres. The arrows bracket regions where the ocular dominance bands form broad mediolateral strips. The monocular segment occupies the caudal two-thirds of area 17. Left is lateral and up is anterior. Scale bar = 1 mm in B (applies to A,B).
Fig. 8
Fig. 8
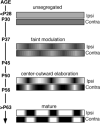
Time course of ocular dominance band development. The ages of individual ferret kits in this study and the four stages of segregation apparent from their transneuronal labeling are schematically represented. Inputs representing both eyes initially occupy the entire binocular segment of area 17 with no detectable modulation in their patterns. At postnatal day (P)37 and P45, a faint modulation is evident. By P50 and P56, the amplitude of modulation has increased greatly, but peaks only at column centers. In P63 and older kits, the pattern of ocular dominance bands is mature, with a square wave-like pattern of alternating intense ipsilateral and contralateral eye inputs.

Similar articles

Cited by

References

    1. Albus K, Wolf W. Early post-natal development of neuronal function in the kitten's visual cortex: a laminar analysis. J Physiol. 1984;348:153–185. - PMC - PubMed
    1. Anderson PA, Olavarria J, Van Sluyters RC. The overall pattern of ocular dominance bands in cat visual cortex. J Neurosci. 1988;8:2183–2200. - PMC - PubMed
    1. Antonini A, Stryker MP. Development of individual geniculocortical arbors in cat striate cortex and effects of binocular impulse blockade. J Neurosci. 1993;13:3549–3573. - PMC - PubMed
    1. Ault SJ, Leventhal AG, Vitek DJ, Creel DJ. Abnormal ipsilateral visual field representation in areas 17 and 18 of hypopigmented cats. J Comp Neurol. 1995;354:181–192. - PubMed
    1. Baker GE, Thompson ID, Krug K, Smyth D, Tolhurst DJ. Spatial-frequency tuning and geniculocortical projections in the visual cortex (areas 17 and 18) of the pigmented ferret. Eur J Neurosci. 1998;10:2657–2668. - PubMed

Publication types

Substances