

Mitochondrial disease in mouse results in increased oxidative stress
- PMID: 10220377
- PMCID: PMC21775
- DOI: 10.1073/pnas.96.9.4820
Mitochondrial disease in mouse results in increased oxidative stress
Abstract
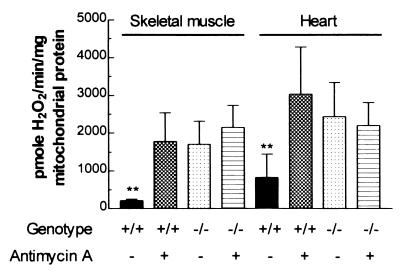
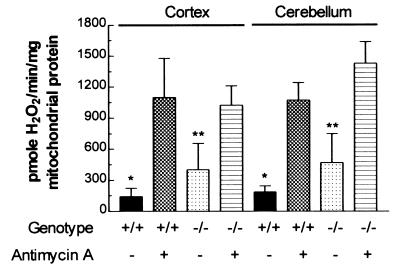
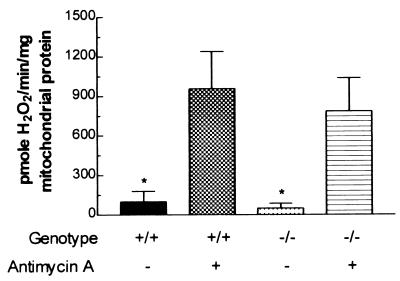
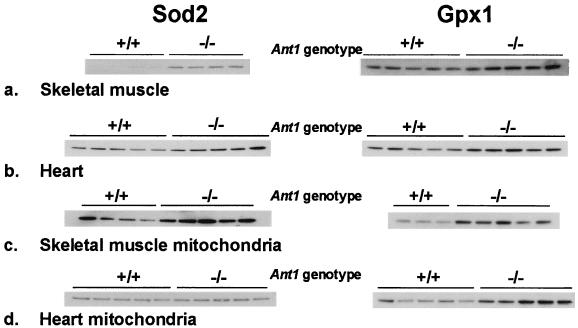
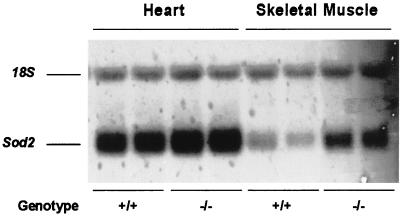
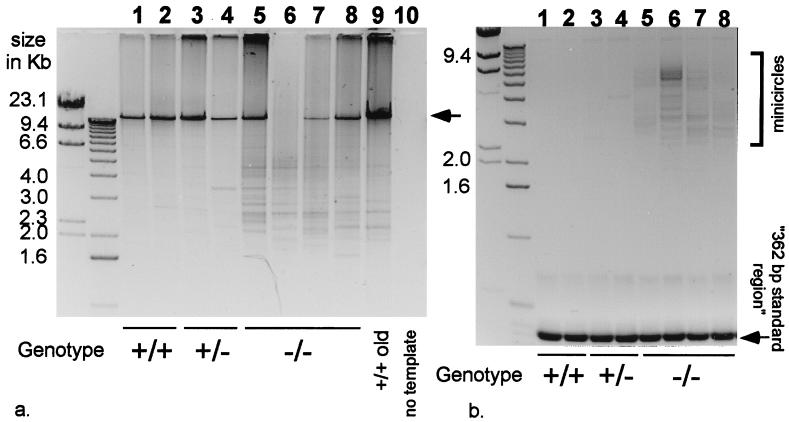
It has been hypothesized that a major factor in the progression of mitochondrial disease resulting from defects in oxidative phosphorylation (OXPHOS) is the stimulation of the mitochondrial production of reactive oxygen species (ROS) and the resulting damage to the mtDNA. To test this hypothesis, we examined the mitochondria from mice lacking the heart/muscle isoform of the adenine nucleotide translocator (Ant1), designated Ant1(tm2Mgr) (-/-) mice. The absence of Ant1 blocks the exchange of ADP and ATP across the mitochondrial inner membrane, thus inhibiting OXPHOS. Consistent with Ant1 expression, mitochondria isolated from skeletal muscle, heart, and brain of the Ant1-deficient mice produced markedly increased amounts of the ROS hydrogen peroxide, whereas liver mitochondria, which express a different Ant isoform, produced normally low levels of hydrogen peroxide. The increased production of ROS by the skeletal muscle and heart was associated with a dramatic increase in the ROS detoxification enzyme manganese superoxide dismutase (Sod2, also known as MnSod) in muscle tissue and muscle mitochondria, a modest increase in Sod2 in heart tissue, and no increase in heart mitochondria. The level of glutathione peroxidase-1 (Gpx1), a second ROS detoxifying enzyme, was increased moderately in the mitochondria of both tissues. Consistent with the lower antioxidant defenses in heart, the heart mtDNAs of the Ant1-deficient mice showed a striking increase in the accumulation of mtDNA rearrangements, whereas skeletal muscle, with higher antioxidant defenses, had fewer mtDNA rearrangements. Hence, inhibition of OXPHOS does increase mitochondrial ROS production, eliciting antioxidant defenses. If the antioxidant defenses are insufficient to detoxify the ROS, then an increased mtDNA mutation rate can result.
Figures
References
-
- Wallace D C. In: The Molecular and Genetic Basis of Neurological Disease. Rosenberg R N, Prusiner S B, DiMauro S, Barchi R L, editors. Boston: Butterworth–Heinemann; 1997. pp. 237–269.
-
- Wallace D C, Melov S. Nat Genet. 1998;19:105–106. - PubMed
-
- Turrens J F, Freeman B A, Levitt J G, Crapo J D. Arch Biochem Biophys. 1982;217:401–410. - PubMed
Publication types
MeSH terms
Substances
Grants and funding
LinkOut - more resources
Full Text Sources
Other Literature Sources
Molecular Biology Databases
Miscellaneous
