. 1999 Apr 27;96(9):4908-13.
doi: 10.1073/pnas.96.9.4908.

Motility of ActA protein-coated microspheres driven by actin polymerization

Affiliations

Motility of ActA protein-coated microspheres driven by actin polymerization

L A Cameron et al. Proc Natl Acad Sci U S A. .

Abstract

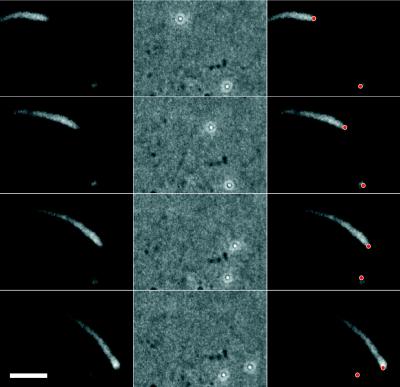
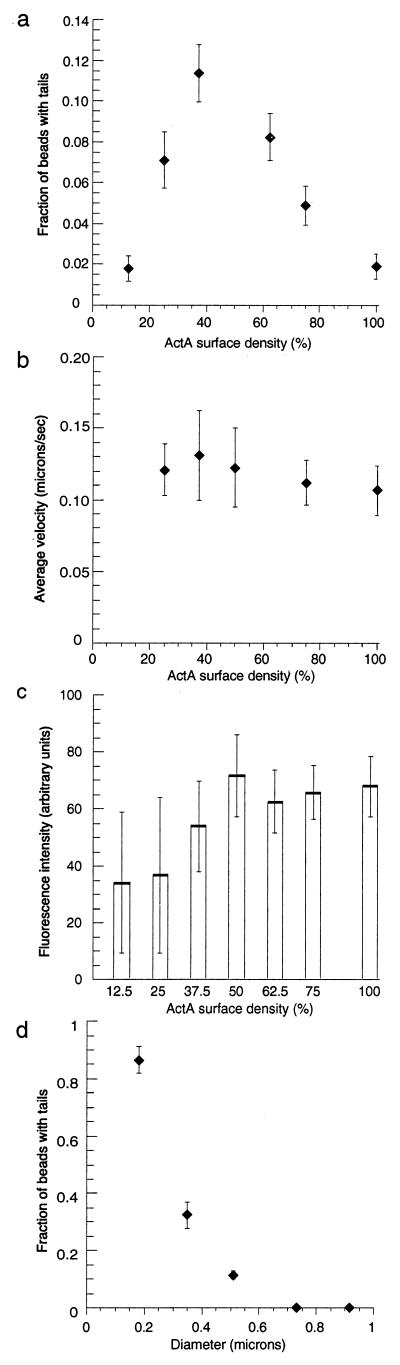
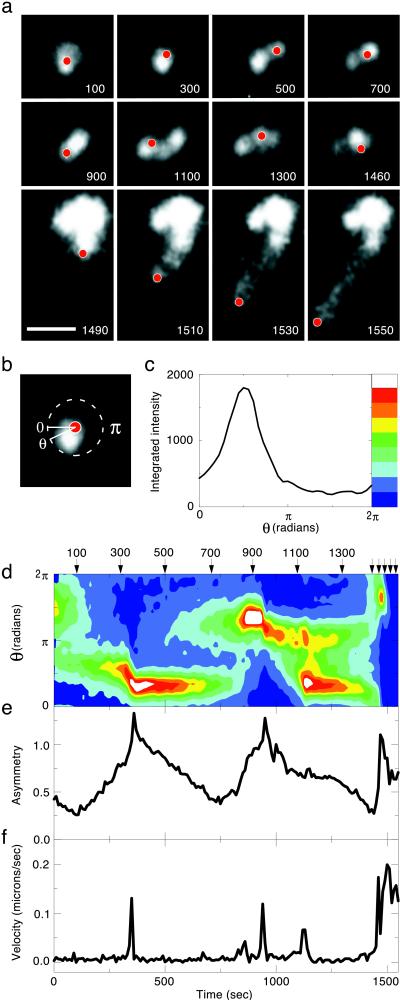
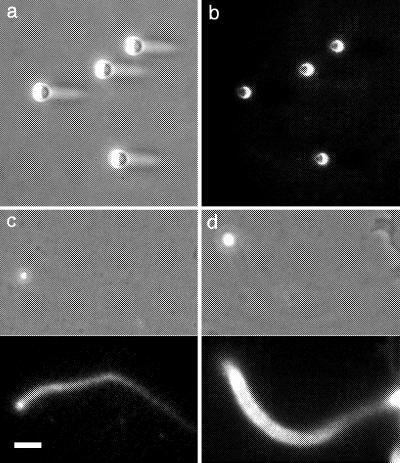
Actin polymerization is required for the generation of motile force at the leading edge of both lamellipodia and filopodia and also at the surface of motile intracellular bacterial pathogens such as Listeria monocytogenes. Local catalysis of actin filament polymerization is accomplished in L. monocytogenes by the bacterial protein ActA. Polystyrene beads coated with purified ActA protein can undergo directional movement in an actin-rich cytoplasmic extract. Thus, the actin polymerization-based motility generated by ActA can be used to move nonbiological cargo, as has been demonstrated for classical motor molecules such as kinesin and myosin. Initiation of unidirectional movement of a symmetrically coated particle is a function of bead size and surface protein density. Small beads (</=0.5 micrometer in diameter) initiate actin-based motility when local asymmetries are built up by random fluctuations of actin filament density or by thermal motion, demonstrating the inherent ability of the dynamic actin cytoskeleton to spontaneously self-organize into a polar structure capable of generating unidirectional force. Larger beads (up to 2 micrometers in diameter) can initiate movement only if surface asymmetry is introduced by coating the beads on one hemisphere. This explains why the relatively large L. monocytogenes requires polar distribution of ActA on its surface to move.


Figures

Figure 1
Figure 1
Actin-based movement of a 0.5-μm-diameter carboxylated polystyrene microsphere uniformly coated with ActA-His. ActA-His-coated microspheres were incubated in Xenopus egg cytoplasmic extract supplemented with 0.15 mg/ml rhodamine-actin. Four frames from a video sequence are shown, each separated by 30 sec. A stationary bead surrounded by an actin cloud is at the lower right. (Left column) Fluorescence image showing distribution of rhodamine-actin in the comet tail and cloud. (Center column) Phase-contrast image showing position of polystyrene beads. (Right column) Bead positions (red dots) superimposed on fluorescence images. This bead is moving at a rate of 0.153 μm/sec. (Bar = 5 μm.)
Figure 2
Figure 2
Motility depends on ActA-His surface density and particle size. (a) For 0.5-μm-diameter polystyrene beads, the probability of comet tail formation strongly depended on ActA-His surface density. Initiation of movement was most efficient when ≈37.5% of available sites were occupied by ActA-His; higher and lower densities inhibited tail formation. Error bars are ±SD. Between 380 and 630 beads were scored at each surface density. (b) For moving 0.5-μm-diameter polystyrene beads, average velocity was independent of ActA-His surface density. Error bars are ±SD; n = 8–16 beads for each point. Differences between points are not statistically significant by Student’s t test. Average velocity of L. monocytogenes in this extract was 0.126 ± 0.035 μm/sec; n = 23. (c) For nonmoving 0.5-μm-diameter polystyrene beads, the intensity and variability of the actin clouds depended on ActA-His surface density. Error bars are ±SD; n = 57–125 for each concentration. Note that SD is large for low ActA surface densities and decreases substantially at higher densities. (d) At optimal ActA-His surface density (37.5% of available sites), the probability of comet tail formation strongly depended on bead diameter. Beads with diameters of 0.7 μm or greater were never observed to form tails whereas most beads of 0.2-μm-diameter formed tails. Error bars are ±SD; n = 100–600 per point. All results (ad) were taken at a 1-hr time-point of incubation at room temperature.
Figure 3
Figure 3
Asymmetry builds up in the actin cloud before bead takeoff. (a) Video sequence of a 0.5-μm-diameter ActA-His-coated bead during the transition from cloud to tail. Rhodamine-actin fluorescence is depicted in gray-scale. The position of the polystyrene bead, as determined from paired phase-contrast images, is indicated by the red dots. Actin filament density in the cloud becomes strikingly asymmetric, and the particle bounces around within the confines of the cloud, before escaping and moving rapidly away ≈1,480 sec into the video sequence. Total time elapsed in seconds is shown at the bottom right corner of each frame. Note time compression for the four frames in the bottom row. The contrast in these last four frames has been digitally enhanced relative to the first eight, so that the dimmer comet tail can be seen as well as the bright cloud. (Bar = 5 μm.) (b) Angular variation of actin density within the cloud for one frame from the video sequence shown in a (at 300 sec). Fluorescence intensity within a circle of 1-μm radius centered on the bead varies as a function of radial angle θ. (c) Actin filament density distribution as a function of angle for the video frame shown in b. For each value of the angle θ, the fluorescence intensity is integrated over a wedge-shaped segment between θ − π/36 and θ + π/36 within a radius of 1 μm around the bead. Color bar shows translation of integrated fluorescence intensity into a color scale, used in d. (d) Actin filament density distribution around this bead as a function of time. The arrows indicate the frames shown in a. Integrated fluorescence intensity as a function of angle was determined as in c for each frame in the video sequence and was depicted by using a color scale. This contour plot shows fluorescence intensity in the cloud as a function of both time and angle. Note that there are two distinct peaks of actin density at 1,125 sec. Note also that each of the three peaks in the contour plot correlates with a velocity spike in f. This plot does not show the obvious asymmetry after the bead starts moving because the fluorescence intensity of the tail is far below that of the actin cloud. (e) Cloud asymmetry for this bead as a function of time. An asymmetric distribution of actin filaments gradually builds in the cloud before each burst of speed. “Asymmetry” here is a scalar describing the degree to which actin filament density is concentrated in a particular sector of a circle centered on the bead. Asymmetry is calculated by computing the SD of the fluorescence intensity as a function of θ and normalizing to the mean values at each time point. A perfectly spherical cloud (SD = 0) would have an asymmetry of 0, but, due to the finite noise in fluorescence intensity, the measured asymmetry is larger. (f) Velocity of this bead as a function of time. Superimposed on apparently random thermal motion of the particle are several sharp velocity peaks that correspond to peaks in actin filament density apparent in d before the rapid escape of the particle near the end of the sequence.
Figure 4
Figure 4
Movement of larger beads asymmetrically coated with ActA-His. (a) 2-μm-diameter carboxylated polystyrene beads shadowed from the left with silicon monoxide. Shadows can be seen on the protected side of the beads in this phase-contrast image. (Bar = 5 μm.) (b) Shadowed beads shown in a were incubated in situ with rhodamine-conjugated BSA and were washed and imaged using epifluorescence. Labeled protein adsorbed preferentially to the uncoated polystyrene surface. (c) Comet tail formation by a 1-μm-diameter shadowed carboxylated polystyrene bead, coated asymmetrically with ActA-His at 12.5% of available sites. (Upper) Phase-contrast. (Lower) Rhodamine-actin fluorescence. This bead is moving at a rate of 0.088 μm/sec. (d) 2-μm-diameter bead treated as in c moving at a rate of 0.019 μm/sec.

References

    1. Dabiri G A, Sanger J M, Portnoy D A, Southwick F S. Proc Natl Acad Sci USA. 1990;87:6068–6072. - PMC - PubMed
    1. Theriot J A, Rosenblatt J, Portnoy D A, Goldschmidt-Clermont P J, Mitchison T J. Cell. 1994;76:505–517. - PubMed
    1. Welch M D, Iwamatsu A, Mitchison T J. Nature (London) 1997;385:265–269. - PubMed
    1. Tilney L G, Portnoy D A. J Cell Biol. 1989;109:1597–1608. - PMC - PubMed
    1. Theriot J A, Mitchison T J, Tilney L G, Portnoy D A. Nature (London) 1992;357:257–260. - PubMed

Publication types

MeSH terms

LinkOut - more resources