Comparative Study
. 1999 Apr 27;96(9):4947-52.
doi: 10.1073/pnas.96.9.4947.

T cell factor-activated transcription is not sufficient to induce anchorage-independent growth of epithelial cells expressing mutant beta-catenin

Affiliations
Comparative Study

T cell factor-activated transcription is not sufficient to induce anchorage-independent growth of epithelial cells expressing mutant beta-catenin

A I Barth et al. Proc Natl Acad Sci U S A. .

Abstract

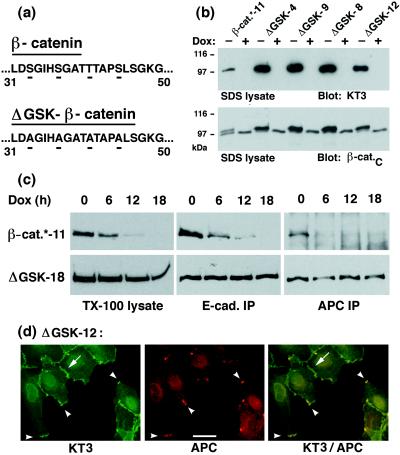
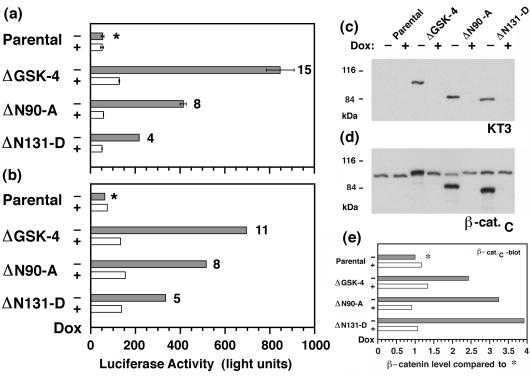
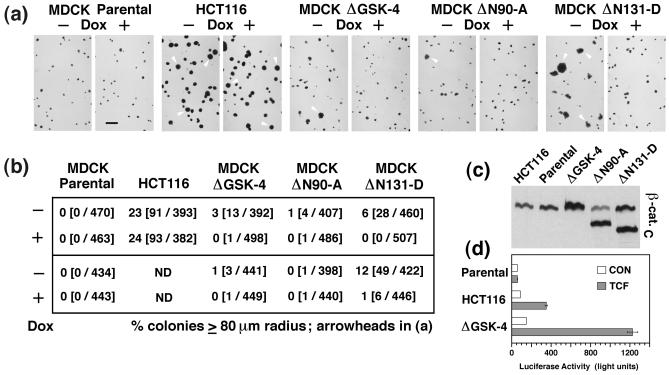
N-terminal mutations in beta-catenin that inhibit beta-catenin degradation are found in primary tumors and cancer cell lines, and increased beta-catenin/T cell factor (TCF)-activated transcription in these cells has been correlated with cancer formation. However, the role of mutant beta-catenin in cell transformation is poorly understood. Here, we compare the ability of different N-terminal mutations of beta-catenin (DeltaN131, DeltaN90, DeltaGSK) to induce TCF-activated transcription and anchorage-independent growth in Madin-Darby canine kidney epithelial cells. Expression of DeltaN90 or DeltaGSK beta-catenin increased TCF-activated transcription but did not induce significant anchorage-independent cell growth. In contrast, deletion of the alpha-catenin-binding site in DeltaN131 beta-catenin reduced TCF-activated transcription, compared with that induced by DeltaN90 or DeltaGSK beta-catenin, but significantly enhanced anchorage-independent cell growth.


Figures

Figure 1
Figure 1
Expression, stability, and subcellular localization of ΔGSK β-catenin in MDCK cells. (a) Illustration of the amino acid changes in the sequence of ΔGSK β-catenin. Serine/threonine residues Ser-33, Ser-37, Thr-41, Ser-45 in the putative GSK-3β phosphorylation site of β-catenin were changed to Ala (for details, see Material and Methods). (b) Dox-repressible expression of tagged wild-type β-catenin* and ΔGSK β-catenin in independently isolated MDCK clones (designated by numbers). Cells were cultured for 4 days without or with Dox (−/+ Dox) and extracted with 1% SDS. Fifteen micrograms of the protein lysates were subjected to SDS/PAGE and immunoblotted with the tag-antibody KT3 or mAb β-cat.C. Molecular mass standards are indicated in kDa. (c) MDCK clones were cultured for 0, 6, 12, or 18 hr with Dox and extracted with 1% Triton X-100 lysis buffer. Protein lysates were divided: one part was subjected to SDS/PAGE and immunoblotted with mAb KT3 (TX-100 lysates), another was immunoprecipitated with E-cadherin antiserum (E-cad IP), and another was immunoprecipitated with APC antiserum (APC IP). Equivalent fractions of the immunoprecipitates were subjected to SDS/PAGE and immunoblotted with mAb KT3. Three times more of the APC immunoprecipitates from β-catenin*-11 lysates were used than from the ΔGSK-18 lysates, and the blot for β-catenin* was exposed 10 times longer. The rate and efficiency of Dox repression of gene expression is very similar in different MDCK clones (27). Therefore, differences in the amounts of protein remaining after addition of Dox indicate the relative stability of each protein. (d) MDCK clones were double-stained with mAb KT3 against the epitope tag in ΔGSK β-catenin and with affinity-purified antiserum against APC protein. ΔGSK β-catenin localized to sites of cell–cell contact (arrow) and colocalized with APC protein in clusters at the tip of membrane extensions (arrowheads). (Bar = 20 μm.)
Figure 2
Figure 2
Accumulation of low-molecular-mass β-catenin pools in MDCK clones expressing mutant β-catenin. Proteins extracted from MDCK clones ΔN90-A/+Dox (a) ΔN90-A/-Dox (b), ΔN131-D/-Dox (c), and ΔGSK-4/-Dox (d) were fractionated by Superose 6 size-exclusion chromatography as described in Materials and Methods. Equal amounts of fractions 8–31 were separated by SDS/PAGE and immunoblotted with antibodies specific for E-cadherin, α-catenin, and β-catenin; a second, longer exposure of the β-catenin immunoblots (β-catL) is shown to visualize small amounts of mutant β-catenin in high-molecular-mass fractions 8–10. The β-catenin antibody detected both endogenous β-catenin (single band in a and higher-molecular-mass bands in b and c) and ΔN90 or ΔN131 β-catenins (lower-molecular-mass bands in b and c). The single β-catenin band in d represents the total of both endogenous and ΔGSK β-catenin because the electrophoretic mobility of endogenous and ΔGSK β-catenin was very similar (see Fig. 1). β-Catenin immunoblots were quantified, and protein concentrations in each fraction were measured as percentage of all endogenous (solid lines in ac), percentage of all mutant (dotted lines in b and c), and percentage of total (sum of endogenous and ΔGSK β-catenin; dashed line in d).
Figure 3
Figure 3
Increased TCF reporter activity in MDCK clones expressing mutant β-catenin. (a and b) Parental MDCK cells and MDCK clones expressing mutant β-catenin were preincubated for 3 days without or with Dox (−/+Dox) and then cotransfected with pTOPFLASH/pSV-β-galactosidase. Luciferase activities (relative light units) were corrected for differences in transfection efficiencies, which were estimated by β-galactosidase activities in the same samples. Data from two independent experiments are summarized in a and b; bars represent mean values from two independent samples (a) or one sample (b). Numbers at the head of the bars represent “fold activation” compared with luciferase activity in parental cultures without (−) Dox (∗) for each experiment. TCF-activated transcription of the luciferase reporter was higher in clones expressing the mutant β-catenins (−Dox, shaded bars) compared with cultures in which expression of mutant β-catenins was repressed (+Dox, open bars) or with parental cells. (c and d) Parallel cultures to those reported in a were extracted with 1% SDS, and 15-μg protein lysates were subjected to SDS/PAGE and immunoblotted with mAb KT3 (c) or mAb β-cat.C (d). Molecular mass standards are indicated in kDa. (e) Levels of total (sum of endogenous and mutant) β-catenin were quantified from the β-cat.C immunoblot. x axis represents “fold expression” compared with the level of endogenous β-catenin in the parental culture/−Dox (∗).
Figure 4
Figure 4
MDCK cells expressing ΔN131 β-catenin exhibit increased growth in soft agar compared with cells expressing ΔN90 or ΔGSK β-catenin. (a) Photomicrographs of colonies 15 days after plating in soft agar. Parental MDCK cells, the human colon cancer cell line HCT116, and MDCK clones ΔGSK-4, ΔN90-A, and ΔN131-D were preincubated for 2 days −/+Dox and cultured 15 days −/+Dox in soft agar. Colonies were stained overnight with p-iodonitrotetrazolium violet. Representative images of two independent experiments are shown, and some of the colonies with a radius of ≥80 μm in these images are marked with arrowheads. (Bar = 500 μm.) (b) Percentage of colonies that had a radius of ≥80 μm in the culture; numbers in parentheses are the numbers of colonies with ≥80-μm radius per total numbers of measured colonies. Results from two independent experiments are shown. (c) HCT116 cells, MDCK parental cells, and MDCK clones were extracted with 1% SDS, and 10-μg protein lysates were subjected to SDS/PAGE and immunoblotted with mAb β-cat.C. (d) In parallel with SDS extraction shown in c, part of the cultures of MDCK parental cells, HCT116 cells, or MDCK clone ΔGSK-4 were transfected with control vector pFOPtkFLASH (CON, open bars) or pTOPtkFLASH (TCF, shaded bars). Bars represent values from one sample (CON) or mean values from two independent samples (TCF).

References

    1. Gumbiner B M. Curr Opin Cell Biol. 1995;7:634–640. - PubMed
    1. Peifer M. Trends Cell Biol. 1995;5:224–229. - PubMed
    1. Barth A I, Näthke I S, Nelson W J. Curr Opin Cell Biol. 1997;9:683–690. - PubMed
    1. Aberle, H., Butz, S., Stappert, J., Weissig, H., Kemler, R. & Hoschuetzky, H. (1994) J. Cell Sci. 3655–3663. - PubMed
    1. Rimm D L, Koslov E R, Kebriaei P, Morrow J L. Proc Natl Acad Sci USA. 1995;92:8813–8817. - PMC - PubMed

Publication types

LinkOut - more resources