. 1999 Apr 27;96(9):5177-81.
doi: 10.1073/pnas.96.9.5177.

Tracking the intracellular path of poly(ethylenimine)/DNA complexes for gene delivery

Affiliations

Tracking the intracellular path of poly(ethylenimine)/DNA complexes for gene delivery

W T Godbey et al. Proc Natl Acad Sci U S A. .

Abstract

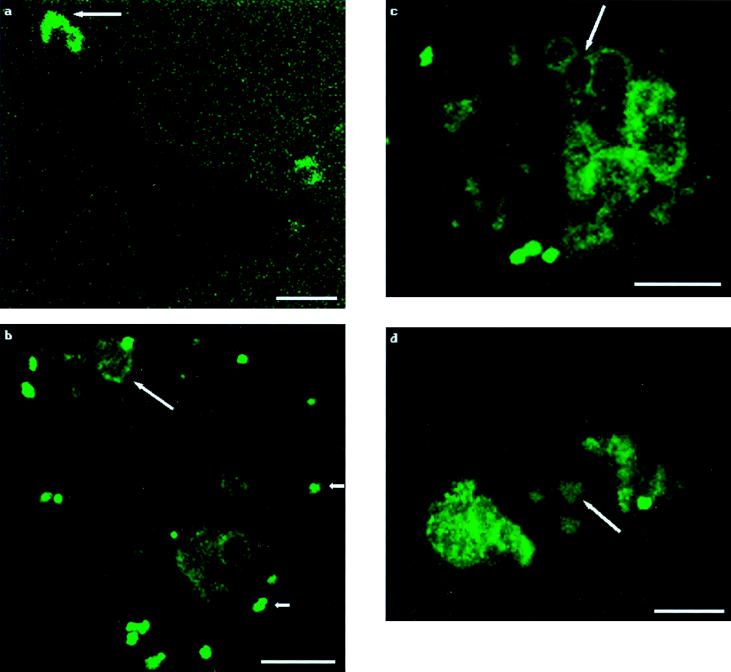
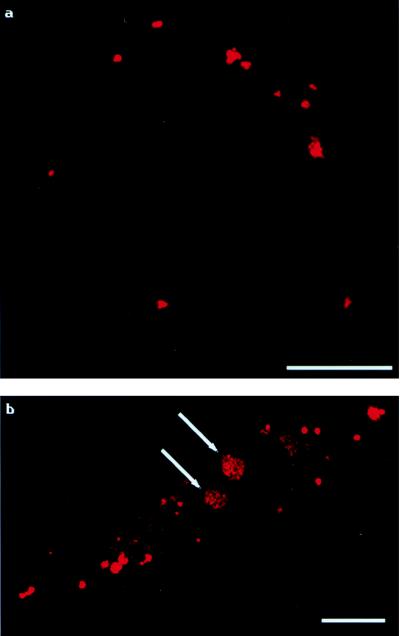
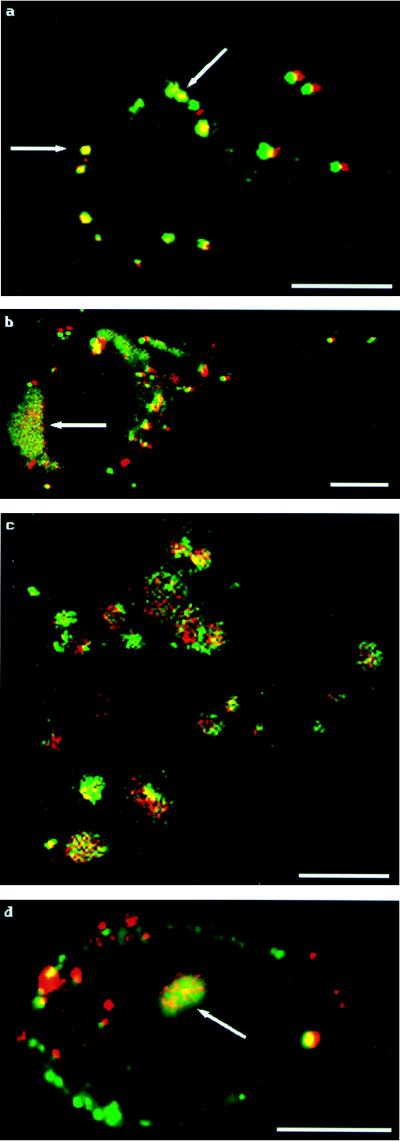
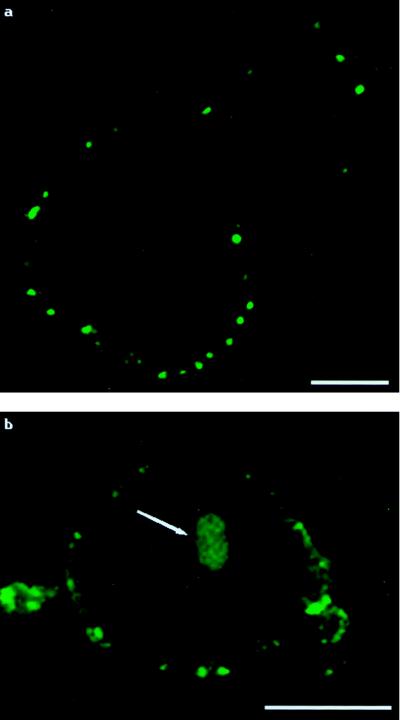
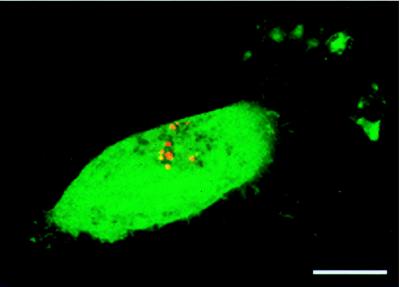
Poly(ethylenimine) (PEI) is one of a number of polycations that has been used successfully to transfer genes into living cells. Although PEI shows promise in the field of gene therapy, to date no rigorous proof of mechanism has been published regarding the fate of PEI/DNA administered for transfection. Here we show, by using fluorescent labeling and confocal microscopy, the paths of PEI/DNA complexes from endocytosis to gene expression. We found that complexes attach to cell surfaces and migrate into clumps that are endocytosed. The endocytotic vesicles grow in number and size and are occasionally seen to lyse. Most interesting is the fact that endocytosed PEI, whether administered with or without DNA, undergoes nuclear localization in the form of ordered structures.


Figures

Figure 1
Figure 1
Tracking of labeled-PEI/DNA complexes. Each panel shows one cell. Times posttransfection are as follows. (a) At 30 minutes posttransfection, a patch of fluorescence is apparent on the exterior of the cell (which is visible only as a silhouette), as indicated by the arrow. Note that the background shows evenly scattered fluorescence. (b) At 3 hours posttransfection, clumps of fluorescence are present on the plasma membrane (short arrows), and endosomes are forming (long arrow). (c) At 3.5 hours posttransfection, endocytotic vesicles are larger and more numerous. Fluorescence is concentrated at the inner surfaces of these vesicles, illustrated by the arrow. (d) At 4.5 hours posttransfection, one of three packets of fluorescence that are easily distinguishable in the nucleus is indicated by the arrow. (Bar = 10 μm.)
Figure 2
Figure 2
Tracking of PEI/labeled-DNA complexes. The pattern of fluorescence is similar to that of labeled-PEI/DNA complexes. Each panel shows one cell. (a) At 2.5 hours posttransfection, complexes are seen as clumps on the cell exterior. (b) At 4 hours posttransfection, organized fluorescence is present within nuclei (indicated by arrows). (Bar = 10 μm.)
Figure 3
Figure 3
Tracking of double-labeled PEI/DNA complexes. The fluorescence patterns for single-labeled complexes are also seen for double-labeled complexes. (a) At 2 hours posttransfection, visible complexes appear as clumps on the cell’s exterior, as indicated by arrows. (b) At 3 hours posttransfection, both surface aggregation and endosomes are visible. The arrow indicates endosomal formation. (c) At 4 hours posttransfection, endosomes containing both PEI and DNA are visible throughout the cell cytoplasm. (d) At 4.5 hours posttransfection, fluorescent structures containing both PEI and DNA inside the cell nucleus are present, as indicated by the arrow. (Bar = 10 μm.)
Figure 4
Figure 4
Administration of labeled PEI to cells without plasmid present. Each panel shows one cell. (a) At 2.5 hours posttransfection, as with labeled complexes, labeled PEI initially forms discrete aggregates on cell exteriors. (b) At 6.0 hours posttransfection, even without plasmid present, labeled PEI enters cell nuclei in an organized fashion. The arrow indicates PEI within the cell nucleus. (Bar = 10 μm.)
Figure 5
Figure 5
Location of delivered plasmid in a positively transfected cell (74 hours posttransfection). Evidence of positive transfection is easily noted by the expression of the green fluorescent protein reporter. The location of labeled plasmid can be seen by the colors red and yellow, located primarily in this cell’s nucleus.

References

    1. Boussif O, Lezoualc’h F, Zanta M A, Mergny M D, Scherman D, Demeneix B, Behr J P. Proc Natl Acad Sci USA. 1995;92:7297–7301. - PMC - PubMed
    1. Lambert R C, Maulet Y, Dupont J-L, Mykita S, Craig P, Volsen S, Feltz A. Mol Cell Neurosci. 1996;7:239–246. - PubMed
    1. Boussif O, Zanta M A, Behr J P. Gene Ther. 1996;3:1074–1080. - PubMed
    1. Abdallah B, Hassan A, Benoist C, Goula D, Behr J P, Demeneix B A. Hum Gene Ther. 1996;7:1947–1954. - PubMed
    1. Boletta A, Benigni A, Lutz J, Remuzzi G, Soria M, Monaco L. Hum Gene Ther. 1997;8:1243–1251. - PubMed

Publication types

LinkOut - more resources