

Characterization of six bacteriophages of serratia liquefaciens CP6 isolated from the sugar beet phytosphere
- PMID: 10223986
- PMCID: PMC91283
- DOI: 10.1128/AEM.65.5.1959-1965.1999
Characterization of six bacteriophages of serratia liquefaciens CP6 isolated from the sugar beet phytosphere
Abstract
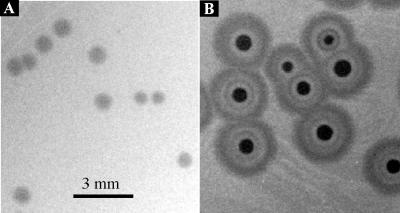
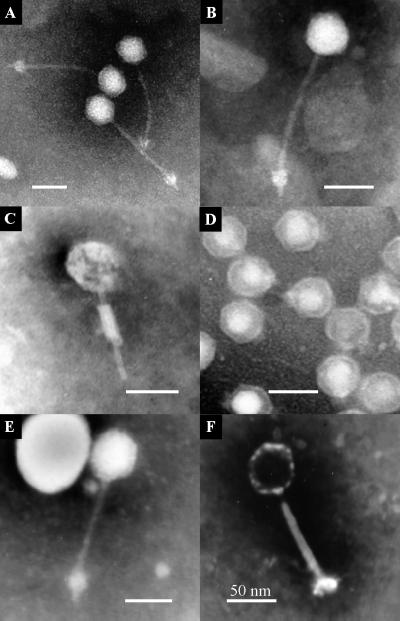
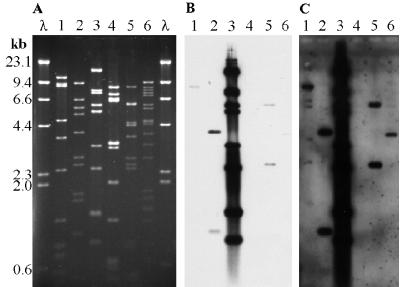
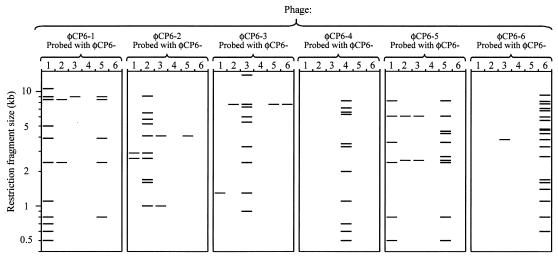
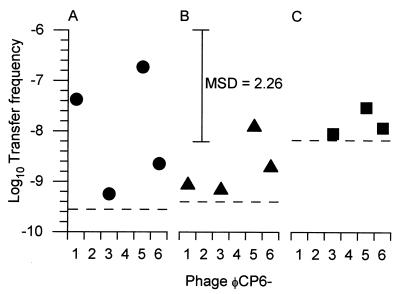
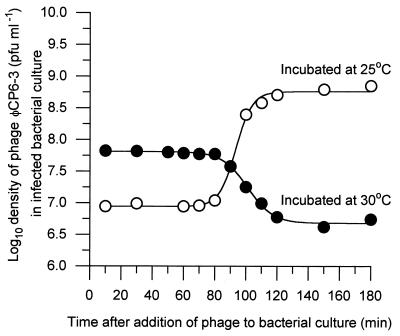
Six phages (PhiCP6-1 to PhiCP6-6) that are commonly found in the phytosphere of sugar beet (Beta vulgaris var. Amethyst) were investigated, and their relative impacts on their host (Serratia liquefaciens CP6) were compared. There were fundamental differences between the two most abundant predators of CP6 (PhiCP6-1 and PhiCP6-4). Like PhiCP6-2 and PhiCP6-5, PhiCP6-1 belonged to the family Siphoviridae, while PhiCP6-4 exhibited the morphology of the family Podoviridae. The other phages were members of the family Myoviridae. DNA-DNA cross-hybridization revealed that PhiCP6-1 and PhiCP6-4 had little common DNA, although all of the other phages exhibited some genetic similarity. Like PhiCP6-2, PhiCP6-3, and PhiCP6-5, PhiCP6-1 was capable of forming a lysogenic association with its host, while PhiCP6-4 and PhiCP6-6 appeared to be entirely virulent. Single-step growth curve experiments revealed that PhiCP6-4 had a much shorter latent period and a smaller burst size than PhiCP6-1. Also, PhiCP6-1 could transduce a number of host chromosomal markers with transfer frequencies of 2.9 x 10(-9) to 3.9 x 10(-7), whereas PhiCP6-4 could not transduce S. liquefaciens CP6 genes. When viewed in the context of the strikingly different temporal niches of these phages, our data provide an insight into how bacteriophage interactions with their hosts might reflect the natural ecology of bacteriophages. Our data also illustrate how the potential for gene transfer changes over time in an environment that supports several different phages.
Figures
References
-
- Abedon S T. Selection for bacteriophage latent period length by bacterial density: a theoretical examination. Microb Ecol. 1989;18:79–88. - PubMed
-
- Ackermann H-W. Frequency of morphological phage descriptions in 1995. Arch Virol. 1996;141:209–218. - PubMed
-
- Adams M H. Bacteriophages. New York, N.Y: Interscience Publishers; 1959.
-
- Alexeyev M F, Shokolenko I N, Croughan T P. New mini-Tn5 derivatives for insertion mutagenesis and genetic engineering in Gram-negative bacteria. Can J Microbiol. 1995;41:1053–1055. - PubMed
LinkOut - more resources
Full Text Sources
