

Molecular analysis of microbial community structures in pristine and contaminated aquifers: field and laboratory microcosm experiments
- PMID: 10224013
- PMCID: PMC91310
- DOI: 10.1128/AEM.65.5.2143-2150.1999
Molecular analysis of microbial community structures in pristine and contaminated aquifers: field and laboratory microcosm experiments
Abstract
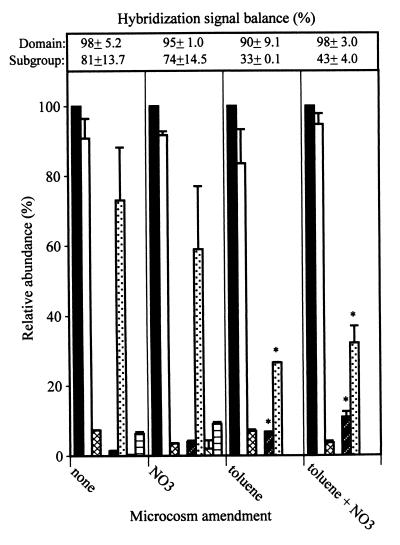
This study used phylogenetic probes in hybridization analysis to (i) determine in situ microbial community structures in regions of a shallow sand aquifer that were oxygen depleted and fuel contaminated (FC) or aerobic and noncontaminated (NC) and (ii) examine alterations in microbial community structures resulting from exposure to toluene and/or electron acceptor supplementation (nitrate). The latter objective was addressed by using the NC and FC aquifer materials for anaerobic microcosm studies in which phylogenetic probe analysis was complemented by microbial activity assays. Domain probe analysis of the aquifer samples showed that the communities were predominantly Bacteria; Eucarya and Archaea were not detectable. At the phylum and subclass levels, the FC and NC aquifer material had similar relative abundance distributions of 43 to 65% beta- and gamma-Proteobacteria (B+G), 31 to 35% alpha-Proteobacteria (ALF), 15 to 18% sulfate-reducing bacteria, and 5 to 10% high G+C gram positive bacteria. Compared to that of the NC region, the community structure of the FC material differed mainly in an increased abundance of B+G relative to that of ALF. The microcosm communities were like those of the field samples in that they were predominantly Bacteria (83 to 101%) and lacked detectable Archaea but differed in that a small fraction (2 to 8%) of Eucarya was detected regardless of the treatment applied. The latter result was hypothesized to reflect enrichment of anaerobic protozoa. Addition of nitrate and/or toluene stimulated microbial activity in the microcosms, but only supplementation of toluene alone significantly altered community structures. For the NC material, the dominant subclass shifted from B+G to ALF, while in the FC microcosms 55 to 65% of the Bacteria community was no longer identifiable by the phylum or subclass probes used. The latter result suggested that toluene exposure fostered the proliferation of phylotype(s) that were otherwise minor constituents of the FC aquifer community. These studies demonstrated that alterations in aquifer microbial communities resulting from specific anthropogenic perturbances can be inferred from microcosm studies integrating chemical and phylogenetic probe analysis and in the case of hydrocarbon contamination may facilitate the identification of organisms important for in situ biodegradation processes. Further work integrating and coordinating microcosm and field experiments is needed to explore how differences in scale, substrate complexity, and other hydrogeological conditions may affect patterns observed in these systems.
Figures
 ,
Eucarya;
,
Eucarya;
 , ALF;
  , B+G;
 , SRB;
 , HGC. Data are
means of duplicate measurements (± standard deviations). An asterisk
indicates that the hybridization signal from a given probe differed
significantly (P ≤ 0.05) from that for the nonamended
control.
, HGC. Data are
means of duplicate measurements (± standard deviations). An asterisk
indicates that the hybridization signal from a given probe differed
significantly (P ≤ 0.05) from that for the nonamended
control.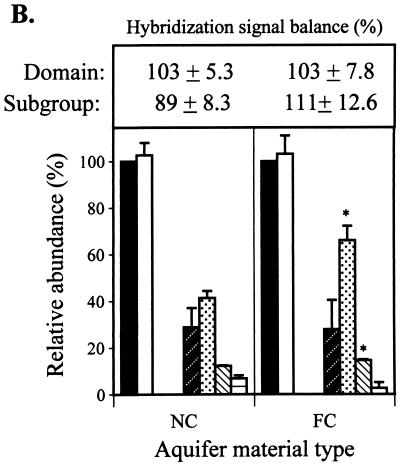 ,
Eucarya;
, ALF; , B+G;
, SRB;
, HGC. Data are
means of duplicate measurements (± standard deviations). An asterisk
indicates that the hybridization signal from a given probe differed
significantly (P ≤ 0.05) from that for the nonamended
control.
,
Eucarya;
, ALF; , B+G;
, SRB;
, HGC. Data are
means of duplicate measurements (± standard deviations). An asterisk
indicates that the hybridization signal from a given probe differed
significantly (P ≤ 0.05) from that for the nonamended
control.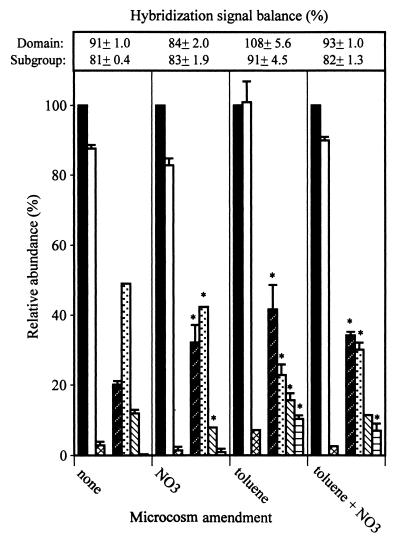
Similar articles
-
In situ analysis of denitrifying toluene- and m-xylene-degrading bacteria in a diesel fuel-contaminated laboratory aquifer column.Appl Environ Microbiol. 1997 Jun;63(6):2136-41. doi: 10.1128/aem.63.6.2136-2141.1997. Appl Environ Microbiol. 1997. PMID: 9172330 Free PMC article.
-
Mineralization of PAHs in coal-tar impacted aquifer sediments and associated microbial community structure investigated with FISH.Chemosphere. 2007 Nov;69(10):1563-73. doi: 10.1016/j.chemosphere.2007.05.058. Epub 2007 Jul 6. Chemosphere. 2007. PMID: 17617439
-
Depth-resolved quantification of anaerobic toluene degraders and aquifer microbial community patterns in distinct redox zones of a tar oil contaminant plume.Appl Environ Microbiol. 2008 Feb;74(3):792-801. doi: 10.1128/AEM.01951-07. Epub 2007 Dec 14. Appl Environ Microbiol. 2008. PMID: 18083871 Free PMC article.
-
In situ microcosms in aquifer bioremediation studies.FEMS Microbiol Rev. 1997 Jul;20(3-4):489-502. doi: 10.1111/j.1574-6976.1997.tb00332.x. FEMS Microbiol Rev. 1997. PMID: 9299716 Review.
-
Metabolism of alkylbenzenes, alkanes, and other hydrocarbons in anaerobic bacteria.Biodegradation. 2000;11(2-3):85-105. doi: 10.1023/a:1011122631799. Biodegradation. 2000. PMID: 11440245 Review.
Cited by
-
Mycobacterium diversity and pyrene mineralization in petroleum-contaminated soils.Appl Environ Microbiol. 2001 May;67(5):2222-9. doi: 10.1128/AEM.67.5.2222-2229.2001. Appl Environ Microbiol. 2001. PMID: 11319104 Free PMC article.
-
Effects of heavy fuel oil on the bacterial community structure of a pristine microbial mat.Appl Environ Microbiol. 2007 Oct;73(19):6089-97. doi: 10.1128/AEM.01352-07. Epub 2007 Aug 17. Appl Environ Microbiol. 2007. PMID: 17704271 Free PMC article.
-
Linkage Between Dissolved Organic Matter Transformation, Bacterial Carbon Production, and Diversity in a Shallow Oligotrophic Aquifer: Results From Flow-Through Sediment Microcosm Experiments.Front Microbiol. 2020 Nov 5;11:543567. doi: 10.3389/fmicb.2020.543567. eCollection 2020. Front Microbiol. 2020. PMID: 33250862 Free PMC article.
-
Experimental procedures for studying microbial reactions under high hydrogen gas saturations in microcosms.MethodsX. 2025 May 10;14:103344. doi: 10.1016/j.mex.2025.103344. eCollection 2025 Jun. MethodsX. 2025. PMID: 40475891 Free PMC article.
-
A shallow BTEX and MTBE contaminated aquifer supports a diverse microbial community.Microb Ecol. 2004 Nov;48(4):589-600. doi: 10.1007/s00248-004-0001-2. Epub 2004 Oct 28. Microb Ecol. 2004. PMID: 15696392
References
-
- Amann, R. I. Personal communication.
-
- Amann R, Ludwig W, Schleifer K-H. Identification of uncultured bacteria: a challenging task for molecular taxonomists. ASM News. 1994;60:360–365.
Publication types
MeSH terms
Substances
LinkOut - more resources
Full Text Sources
