. 1999 May 3;145(3):527-38.
doi: 10.1083/jcb.145.3.527.

The ligand for osteoprotegerin (OPGL) directly activates mature osteoclasts

Affiliations

The ligand for osteoprotegerin (OPGL) directly activates mature osteoclasts

T L Burgess et al. J Cell Biol. .

Abstract

Osteoprotegerin (OPG) and OPG-ligand (OPGL) potently inhibit and stimulate, respectively, osteoclast differentiation (Simonet, W.S., D.L. Lacey, C.R. Dunstan, M. Kelley, M.-S. Chang, R. Luethy, H.Q. Nguyen, S. Wooden, L. Bennett, T. Boone, et al. 1997. Cell. 89:309-319; Lacey, D.L., E. Timms, H.-L. Tan, M.J. Kelley, C.R. Dunstan, T. Burgess, R. Elliott, A. Colombero, G. Elliott, S. Scully, et al. 1998. Cell. 93: 165-176), but their effects on mature osteoclasts are not well understood. Using primary cultures of rat osteoclasts on bone slices, we find that OPGL causes approximately sevenfold increase in total bone surface erosion. By scanning electron microscopy, OPGL-treated osteoclasts generate more clusters of lacunae on bone suggesting that multiple, spatially associated cycles of resorption have occurred. However, the size of individual resorption events are unchanged by OPGL treatment. Mechanistically, OPGL binds specifically to mature OCs and rapidly (within 30 min) induces actin ring formation; a marked cytoskeletal rearrangement that necessarily precedes bone resorption. Furthermore, we show that antibodies raised against the OPGL receptor, RANK, also induce actin ring formation. OPGL-treated mice exhibit increases in blood ionized Ca++ within 1 h after injections, consistent with immediate OC activation in vivo. Finally, we find that OPG blocks OPGL's effects on both actin ring formation and bone resorption. Together, these findings indicate that, in addition to their effects on OC precursors, OPGL and OPG have profound and direct effects on mature OCs and indicate that the OC receptor, RANK, mediates OPGL's effects.


Figures
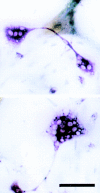
Figure 1
Figure 1
Mature rat OCs stain intensely for TRAP. OCs isolated from the long bones of 2-d-old rat pups were plated on cortical bone slices and stained for TRAP (purple). Two representative examples are shown; on average we obtain 30–50 OCs per 4 × 4 mm bone slice, clearly the density of OCs is low in these cultures. Multinuclearity varies from three to ∼30 nuclei per OC. Mononuclear cells are visible and some, but not all are TRAP positive. Bar, 50 μm.
Figure 6
Figure 6
OPGL and anti-RANK rapidly induce actin ring formation in mature OCs. (A) Representative examples of F-actin–containing structures in mature OCs were detected using Texas red–labeled phalloidin. OCs containing F-actin structures similar to those shown in the top row were not considered to be actin rings; while OCs with partial, full, and multiple actin rings were scored as actin ring–containing OCs (bottom row). The scale bar measures 50 μm. (B) The percentage of OCs containing actin rings at time zero (open bar); 30 min (gray bars); or at 2 h (black bars) under control (no treatment); OPGL (50 ng/ml for 30 min, 10 ng/ml for 2 h); anti-RANK (5 μg/ml); OPGL together with OPG-Fc (10 and 130 ng/ml, respectively); OPG-Fc (130 ng/ml); and anti-RANK together with soluble RANK (5 and 10 μg/ml), respectively, are shown. The number of total OCs counted under the various conditions in this experiment are shown above individual bars. Similar effects were seen in two other experiments.
Figure 6
Figure 6
OPGL and anti-RANK rapidly induce actin ring formation in mature OCs. (A) Representative examples of F-actin–containing structures in mature OCs were detected using Texas red–labeled phalloidin. OCs containing F-actin structures similar to those shown in the top row were not considered to be actin rings; while OCs with partial, full, and multiple actin rings were scored as actin ring–containing OCs (bottom row). The scale bar measures 50 μm. (B) The percentage of OCs containing actin rings at time zero (open bar); 30 min (gray bars); or at 2 h (black bars) under control (no treatment); OPGL (50 ng/ml for 30 min, 10 ng/ml for 2 h); anti-RANK (5 μg/ml); OPGL together with OPG-Fc (10 and 130 ng/ml, respectively); OPG-Fc (130 ng/ml); and anti-RANK together with soluble RANK (5 and 10 μg/ml), respectively, are shown. The number of total OCs counted under the various conditions in this experiment are shown above individual bars. Similar effects were seen in two other experiments.
Figure 2
Figure 2
Treatment with OPGL increases the total area of bone resorbed without altering OC number. (A) The total area of bone resorbed per bone slice (n = 4) was measured as described in Materials and Methods. Compared with control cultures (untreated), OPGL at 10 ng/ml markedly stimulates osteoclastic bone resorption. A fivefold molar excess of OPG-Fc (130 ng/ml) completely inhibited this stimulation, while OPG-Fc alone (130 ng/ml) has little effect on bone resorption. Data are shown ± 1 SD, compared with the controls, OPGL significantly stimulates the total area of bone resorbed per bone slice (P = 0.0001). (B) OCs containing at least 3 nuclei and exhibiting strong TRAP positive staining from n = 4 bone slices per conditions were counted after 24 h incubation with the indicated treatments (as described above). The data are presented as the average number of OCs per bone slice ± 1 SD, the differences were not statistically significant (P = 0.093). (C) The mean area of bone resorbed per OC is presented for n = 4 slices ± SEM under the same conditions as described above, the differences between OPGL and controls were highly significant (P = 0.0001).
Figure 3
Figure 3
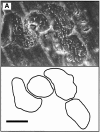
OPGL does not change the mean area nor the distribution of sizes of individual resorption events. (A) A scanning EM showing a typical resorption area generated by an OC treated with OPGL (10 ng/ml) is shown in the upper part of A. The drawing in the lower part of A illustrates how individual resorption events are defined by outlining the boundaries of an individual resorption cycle. These are seen as the rim of individual excavations by scanning EM here, or as dark borders on toluidine blue stained bone (not shown). The areas of all of the individual resorption events on bone slices (n = 4) per condition were measured as described in Materials and Methods. The scale bar measures 25 μm. (B) The calculated mean area per resorption event ± 1 SD are shown: Control (untreated), OPG-Fc at 130 ng/ml, OPGL at 10 ng/ml, or a combination of OPGL and OPG-Fc at the same concentrations. Differences between the mean areas per resorption event under the 4 conditions shown were not significant (P = 0.14). (C) The size distribution of resorption events are displayed in a normalized format to allow the distributions to be visually compared. The number of resorption events differs depending on the different treatments and are shown in each individual panel. Note that the number of resorption events generated by OCs treated with OPG-Fc appears atypically low because only n = 3 slices were analyzed, nonetheless, the ratio of resorption events to TRAP positive OCs on these bone slices were not statistically different from control. The results of the statistical analyses indicate that variances (distribution of event sizes) were not significantly different from the controls (P = 0.135).
Figure 3
Figure 3
OPGL does not change the mean area nor the distribution of sizes of individual resorption events. (A) A scanning EM showing a typical resorption area generated by an OC treated with OPGL (10 ng/ml) is shown in the upper part of A. The drawing in the lower part of A illustrates how individual resorption events are defined by outlining the boundaries of an individual resorption cycle. These are seen as the rim of individual excavations by scanning EM here, or as dark borders on toluidine blue stained bone (not shown). The areas of all of the individual resorption events on bone slices (n = 4) per condition were measured as described in Materials and Methods. The scale bar measures 25 μm. (B) The calculated mean area per resorption event ± 1 SD are shown: Control (untreated), OPG-Fc at 130 ng/ml, OPGL at 10 ng/ml, or a combination of OPGL and OPG-Fc at the same concentrations. Differences between the mean areas per resorption event under the 4 conditions shown were not significant (P = 0.14). (C) The size distribution of resorption events are displayed in a normalized format to allow the distributions to be visually compared. The number of resorption events differs depending on the different treatments and are shown in each individual panel. Note that the number of resorption events generated by OCs treated with OPG-Fc appears atypically low because only n = 3 slices were analyzed, nonetheless, the ratio of resorption events to TRAP positive OCs on these bone slices were not statistically different from control. The results of the statistical analyses indicate that variances (distribution of event sizes) were not significantly different from the controls (P = 0.135).
Figure 7
Figure 7
OPGL rapidly increases blood ionized calcium levels in mice. Randomized groups of mice (n = 5) were injected intravenously with various concentrations of OPGL or PBS as a control as indicated. At 1 h post-injection, blood samples were obtained, ionized calcium measurements performed (see Materials and Methods), and the data are presented as the mean ± SEM. At OPGL doses of 0.05, 0.1, and 0.5 mg/kg, statistically significant increases in ionized calcium were detected (* indicates significantly different compared with PBS, P < 0.05, see Materials and Methods).
Figure 4
Figure 4
Scanning Electron Microscopy reveals that individual OCs are induced by OPGL to undergo multiple cycles of bone resorption. Bone slices from a typical experiment were prepared for, and viewed by scanning EM as described in Materials and Methods. The figure reveals qualitative differences between resorption areas generated under the different conditions shown. (A) Control (untreated). (B) OPGL (10 ng/ml) treatment leads to the generation of numerous connected resorbed areas which expose a network of collagen fibrils. (C) OPGL (10 ng/ml) and OPG-Fc (130 ng/ml) together. (D) OPG-Fc (130 ng/ml) alone. Bar, 25 μm.
Figure 5
Figure 5
Mature osteoclasts specifically bind OPGL and express RANK. Osteoclasts plated on FBS-coated coverslips were stained as described in Materials and Methods. (A) FITC-OPGL binding to multinucleate OCs. (B) Higher magnification of OPGL-binding to multinucleate OCs, as well as some negative mononuclear cells from the same coverslip. (C) Competition of FITC-OPGL with unlabeled OPGL completely blocks binding to OCs and mononuclear cells. (D) Anti-RANK binds to multinucleate OCs. (E) Higher magnification of anti-RANK binding multinucleate OCs, as well as a few negative mononuclear cells from the same coverslip. (F) Competition with soluble RANK completely blocks anti-RANK binding to OCs and mononuclear cells. (G) Anti-β3 integrin reacts strongly with multinucleate OCs. (H) Higher magnification of anti-β3 integrin stained OCs, as well as some negative mononuclear cells. (I) An irrelevant control mouse antibody does not stain any cells in the culture. A, C, D, F, G, and I are all at the same magnification, while B, E, and H are at a higher magnification. Bars, 50 μm.

References

    1. Abe E, Tanaka H, Ishimi Y, Miyaura C, Hayashi T, Nagasawa H, Tomida M, Yamaguchi Y, Hozumi M, Suda T. Differentiation-inducing factor purified from conditioned medium of mitogen-treated spleen cell cultures stimulates bone resorption. Proc Natl Acad Sci USA. 1986;83:5958–5962. - PMC - PubMed
    1. Anderson DM, Maraskovsky E, Billingsley WL, Dougall WC, Tometsko ME, Roux ER, Teepe MC, DuBose RF, Cosman D, Galibert L. A homologue of the TNF receptor and its ligand enhance T-cell growth and dendritic-cell function. Nature. 1997;390:175–179. - PubMed
    1. Arnett TR, Dempster DW. Effect of pH on bone resorption by rat osteoclasts in vitro. Endocrinology. 1986;119:119–124. - PubMed
    1. Boyce BF, Yoneda T, Lowe C, Soriano P, Mundy GR. Requirement of pp60c-srcexpression for osteoclasts to form ruffled borders and resorb bone in mice. J Clin Invest. 1992;90:1622–1627. - PMC - PubMed
    1. Brown MB, Forsythe AB. Robust tests for equality of variances. J Am Stat Assn. 1974;69:364–367.

MeSH terms