. 1999 May 3;145(3):551-62.
doi: 10.1083/jcb.145.3.551.

p120(ctn) acts as an inhibitory regulator of cadherin function in colon carcinoma cells

Affiliations

p120(ctn) acts as an inhibitory regulator of cadherin function in colon carcinoma cells

S Aono et al. J Cell Biol. .

Abstract

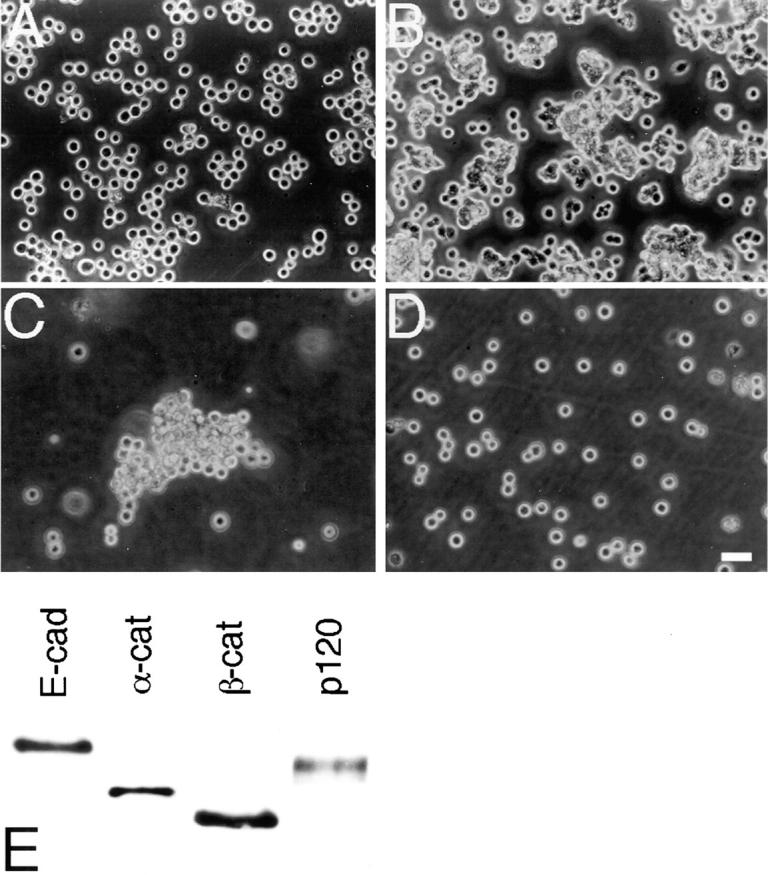
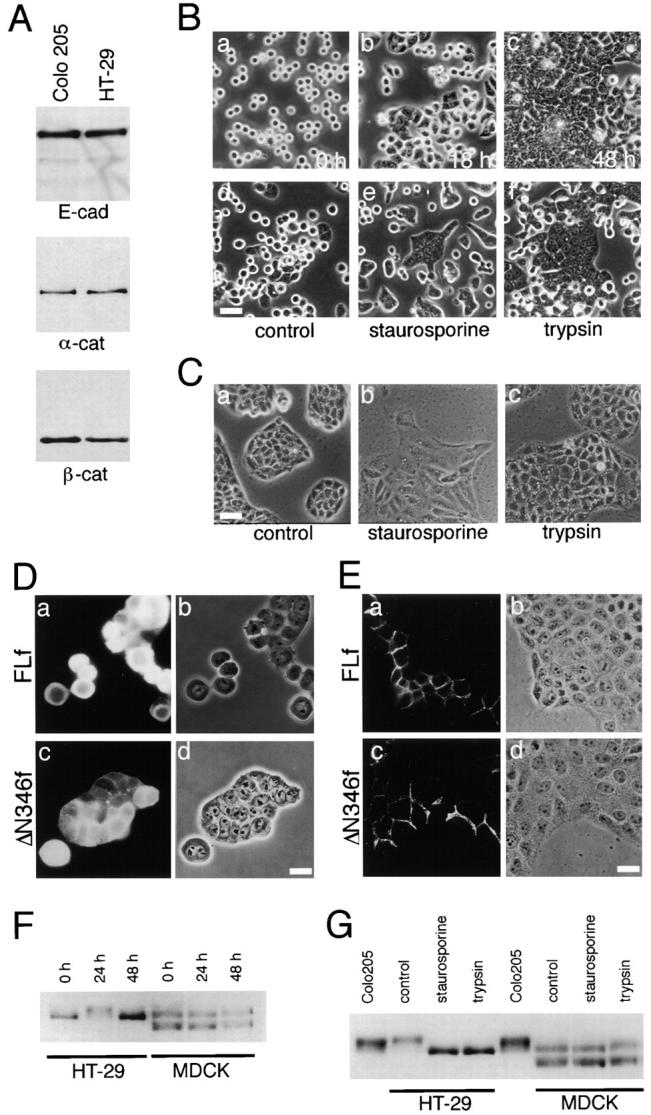
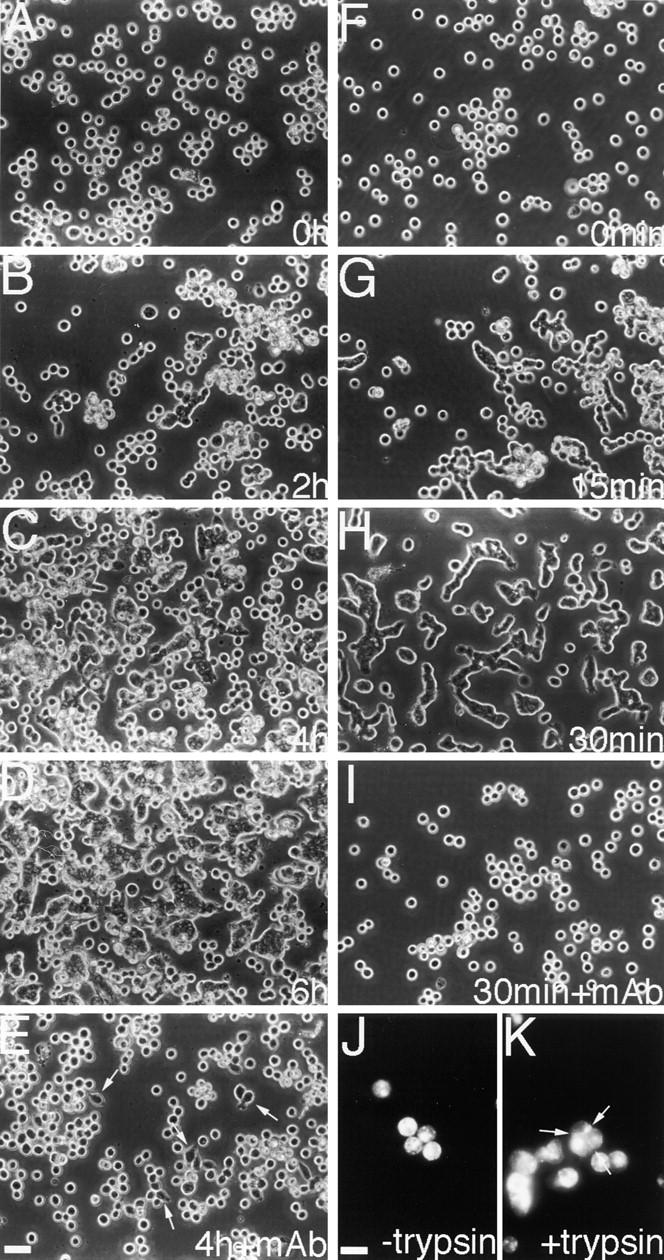
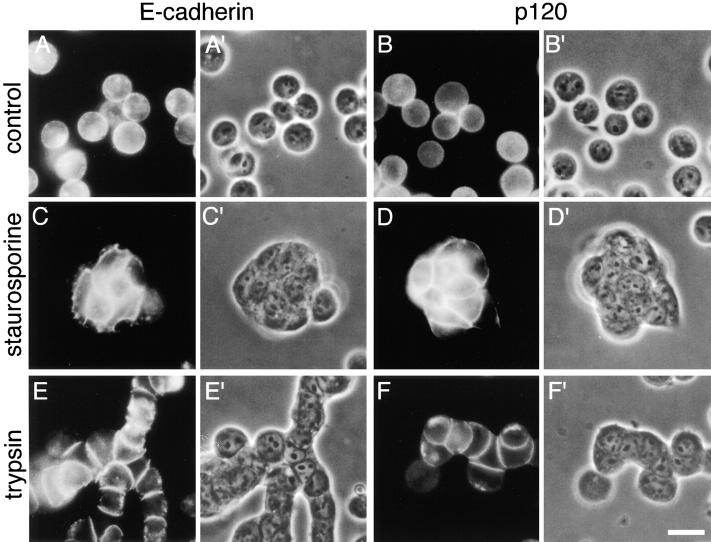
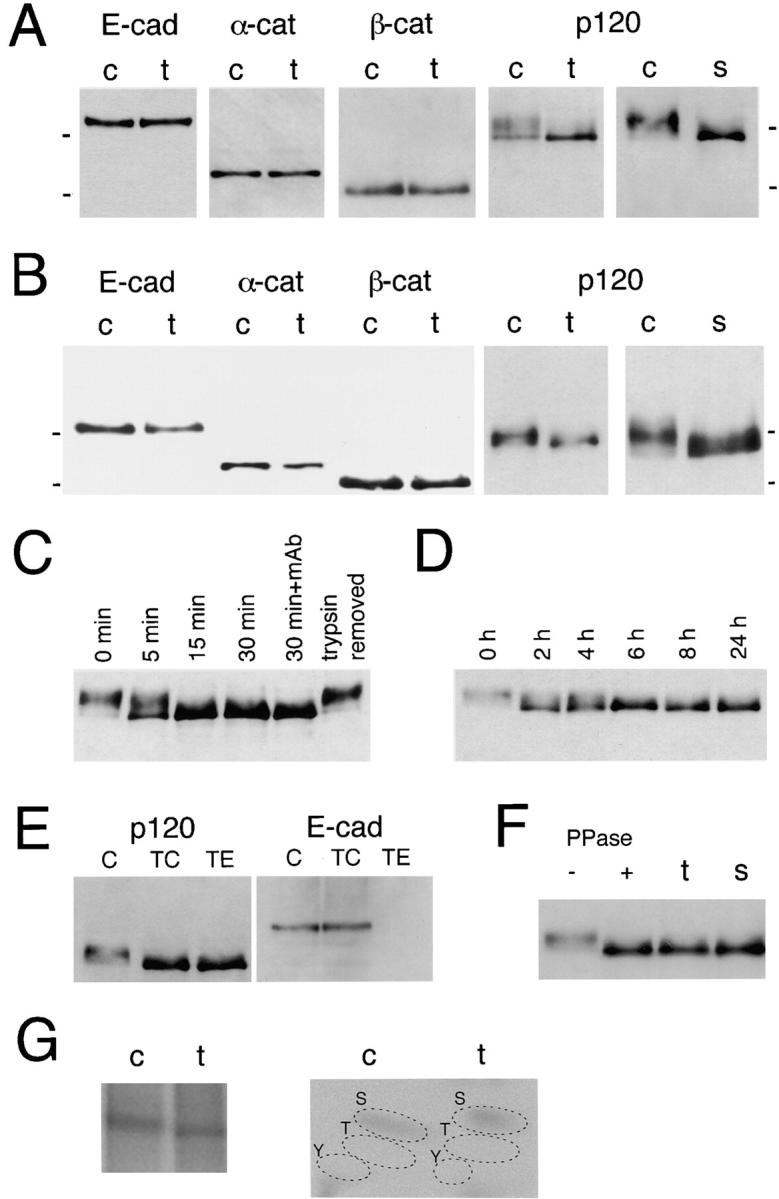
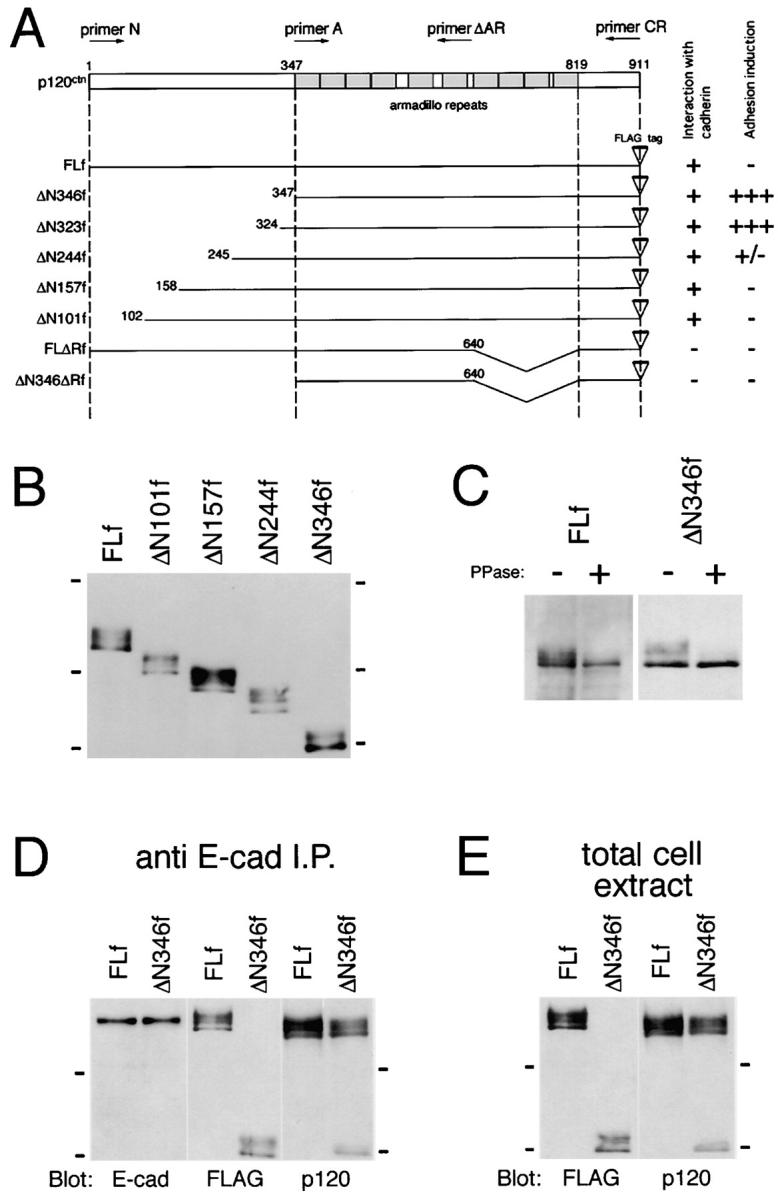
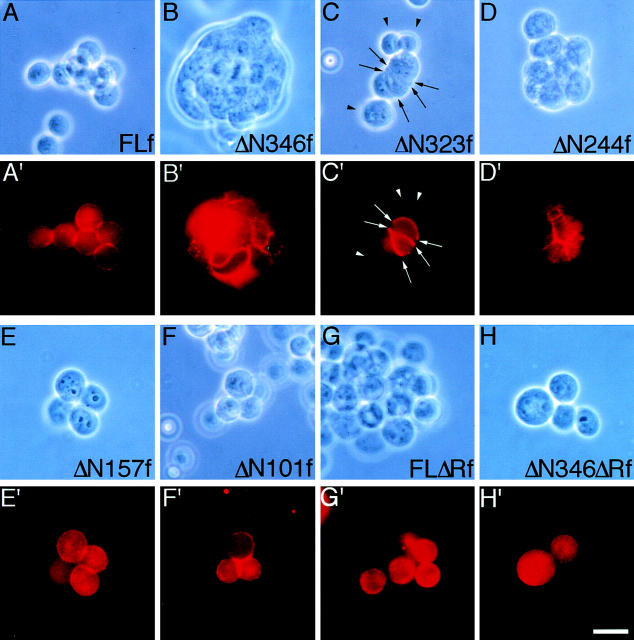
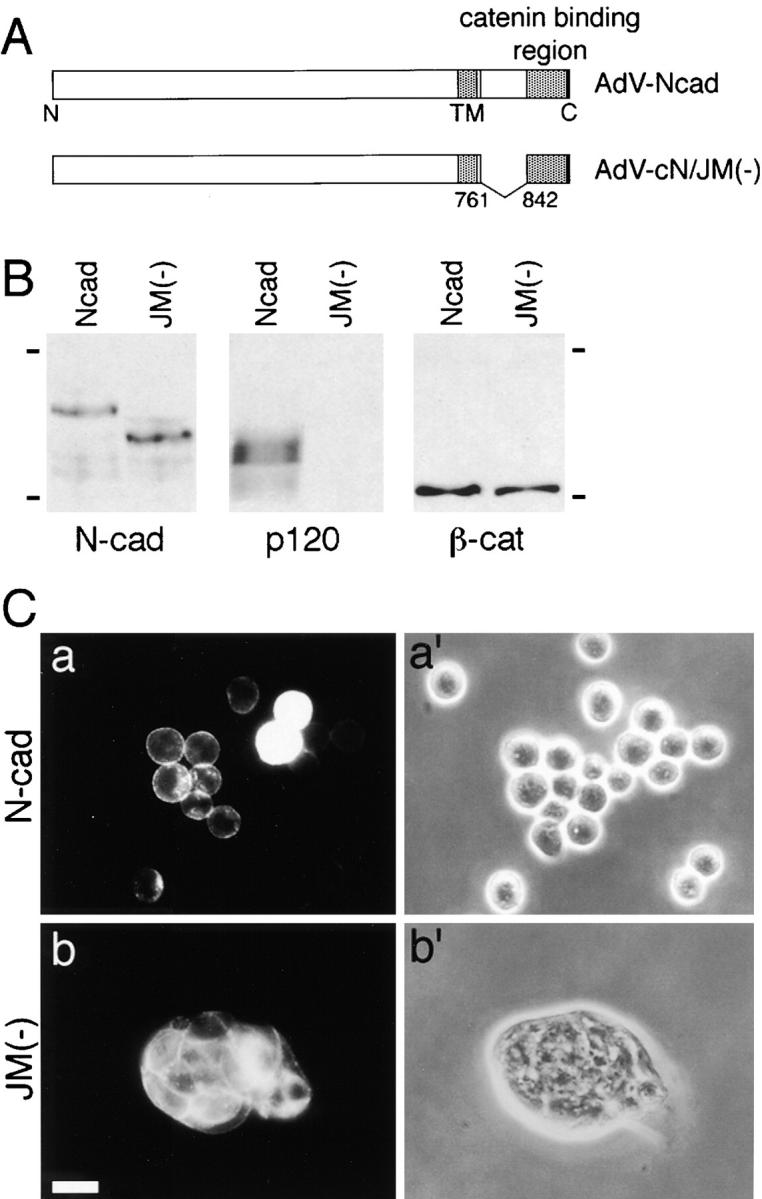
p120(ctn) binds to the cytoplasmic domain of cadherins but its role is poorly understood. Colo 205 cells grow as dispersed cells despite their normal expression of E-cadherin and catenins. However, in these cells we can induce typical E-cadherin-dependent aggregation by treatment with staurosporine or trypsin. These treatments concomitantly induce an electrophoretic mobility shift of p120(ctn) to a faster position. To investigate whether p120(ctn) plays a role in this cadherin reactivation process, we transfected Colo 205 cells with a series of p120(ctn) deletion constructs. Notably, expression of NH2-terminally deleted p120(ctn) induced aggregation. Similar effects were observed when these constructs were introduced into HT-29 cells. When a mutant N-cadherin lacking the p120(ctn)-binding site was introduced into Colo 205 cells, this molecule also induced cell aggregation, indicating that cadherins can function normally if they do not bind to p120(ctn). These findings suggest that in Colo 205 cells, a signaling mechanism exists to modify a biochemical state of p120(ctn) and the modified p120(ctn) blocks the cadherin system. The NH2 terminus-deleted p120(ctn) appears to compete with the endogenous p120(ctn) to abolish the adhesion-blocking action.


Figures

Figure 1
Figure 1
Aggregation profiles of Colo 205 cells. (A) Cells under normal culture conditions, showing their dispersed appearance. (B) Cells in a starved culture. The culture medium was not refreshed for 5 d. Compact aggregate formation was induced. (C and D) Aggregate formation in a rotation culture without (C) or with (D) the anti–E-cadherin antibody SHE78-7. E-Cadherin– dependent aggregation can take place, but cell association in the aggregates is loose. (E) Expression of E-cadherin and catenins detected by Western blotting. E-Cad, E-cadherin; α-cat, αE-catenin; β-cat, β-catenin; p120, p120ctn. Bar, 40 μm.
Figure 7
Figure 7
p120ctn in HT-29 and MDCK cells. (A) Immunoblot detection of E-cadherin (E-cad), α-catenin (α-cat), and β-catenin (β-cat) in HT-29 cells in comparison with Colo 205 cells. Samples with a similar cell number were loaded. (B) Morphological changes in HT-29 cells and effect of trypsin and staurosporine treatments. (a–c) Cells trypsinized as described in Materials and Methods were replated, and cultured for 0 (a), 18 (b), or 48 h (c). (d–e) Cultures preincubated for 18 h with nothing (d), 7 nM staurosporine (e), or 0.001% trypsin (f), followed by another incubation for 6 h (d and e), or 30 min (f). The culture medium was replaced with a serum-free DH when trypsin was added. (C) Effect of staurosporine and trypsin on MDCK colonies precultured for 18 h. a, Untreated; b, incubated with 7 nM staurosporine for 6 h; c, incubated with 0.001% trypsin for 30 min. (D and E) Effect of the ectopic expression of FLf and ΔN346f on HT-29 (D) or MDCK (E) cells. Cells were transfected with cDNA of each construct immediately after cell transfer and cultured for 24 h. The introduced molecules were detected with anti-FLAG antibody M2. Phase-contrast and immunofluorescence images are shown as a set for each result. In D, ΔN346f induced compaction in HT-29 aggregates, whereas FLf had no effect. In E, both FLf and ΔN346f were localized at cell–cell boundaries without affecting cell morphology. (F) Immunoblot analysis of p120ctn in HT-29 and MDCK cells. Cells were transferred as described in B, and cultured for 0, 24, or 48 h. Note the band shift of p120ctn at 24 h in the case of HT-29 cells. In MDCK cells, two p120ctn bands were always detected at the positions of 120 and 100 kD, as described by Ratcliffe et al. (1997), of which the lower band was likely a splicing variant. (G) Effect of staurosporine or trypsin treatment on the p120ctn band pattern. Cells precultured for 18 h were treated with these reagents as described in B and C. In HT-29, both treatments abolished the transient upward shift of the p120ctn band. In MDCK cells, staurosporine slightly induced a downward shift of the p120ctn band, although this may not be clearly seen in this particular blot. For comparison, Colo 205 samples were also loaded. Bars, 40 μm (B and C); 20 μm (D and E).
Figure 2
Figure 2
Induction of compact aggregate formation in Colo 205 cells by staurosporine or trypsin treatment. (A–E) Cells were incubated with 7 nM staurosporine for 0 h (A), 2 h (B), 4 h (C and E), or 6 h (D). (F–I) Cells were cultured with 0.001% trypsin for 0 min (F), 15 min (G), or 30 min (H and I). In E and I, SHE78-7 was added to the cultures. Both treatments induced cell–cell adhesion, unless the anti–E-cadherin antibody was present. Cell spreading was also induced by staurosporine in an SHE78-7–independent manner (arrows in E). (J and K) Immunofluorescence staining for MUC1 in cells treated with (K) or without (J) 0.001% trypsin. MUC1 can be detected in both samples, even at cell–cell boundaries (arrows in K). Bars, 40 μm (A–I); 20 μm (J and K).
Figure 3
Figure 3
Localization of E-cadherin and p120ctn in Colo 205 cells. (A and B) Control Colo 205 cells immunostained for E-cadherin (A) and p120ctn (B). (C–F) Cells treated with 7 nM staurosporine for 6 h (C and D) or with 0.001% trypsin for 30 min (E and F), and immunostained for E-cadherin (C and E) or p120ctn (D and F). (A′–F′) Phase-contrast images of A–F. Bar, 20 μm.
Figure 4
Figure 4
Analyses of E-cadherin and catenins before and after adhesion induction. (A) Immunoblot analysis of E-cadherin– catenin complexes. E-Cadherin was immunoprecipitated from Colo 205 cells treated with 0.001% trypsin for 30 min (t) or from untreated control cells (c), and copurified catenins were detected in each panel as indicated. Note the band shift in p120ctn after trypsin treatment but no changes in the other catenins. A similar result was obtained from cells treated with 7 nM staurosporine (s) for 6 h. (B) Immunoblot detection of E-cadherin and catenins from a whole lysate of cells treated as in A. E-Cad, E-cadherin; α-cat, α-catenin; β-cat, β-catenin; p120, p120ctn. (C and D) Time-dependent changes in the p120ctn band pattern after trypsin (C) or staurosporine (D) treatment. Lane 30 min + mAb, cells were incubated with trypsin in the presence of SHE78-7, an antibody to block E-cadherin, for 30 min; lane trypsin removed, trypsin was removed after 30 min, and then cells were further cultured overnight. Whole cell extracts were loaded. (E) p120ctn-band shift after treatment with 0.01% trypsin in the presence (TC) or absence (TE) of 1 mM Ca2+. The band pattern was similarly changed after both treatments. E-Cadherin was left intact in TC-treated cells, but digested in TE-treated cells. c, Untrypsinized control cells. (F) Effect of alkaline phosphatase treatment on the p120ctn band. p120ctn immunoprecipitated from nontreated Colo 205 cells was incubated with (+) or without (−) protein phosphatase (PPase) at 30°C for 1 h. For comparison, lysates of cells treated with trypsin (t) or staurosporine (s) were loaded. (G) 32P-metabolic labeling and phosphoamino acid (PAA) analysis. (Left) Autoradiogram of 32P-labeled p120ctn separated by SDS-PAGE. Cells were labeled with 32P for 24 h, and treated (t) or not treated (c) with 0.001% trypsin for 30 min. From their lysates, p120ctn was immunopurified, and separated by SDS-PAGE. (Right) PAA analysis. The p120ctn bands in the left panel were excised, and PAAs were separated by two-dimensional electrophoresis. S, phosphoserine; T, phosphothreonine; Y, phosphotyrosine. Molecular weight markers in A and B, 116 and 97.4 × 10³.
Figure 5
Figure 5
Deletion constructs of p120ctn and their expression. (A) A series of p120ctn mutant constructs used in this study. All constructs were attached to a FLAG-tag at the COOH terminus. (B) Immunoblot analysis of p120ctn mutant proteins expressed in Colo 205 cells. Cells were transfected with their cDNAs by use of adenoviral expression vectors. 2 d after viral infection the total cellular proteins were separated by SDS-PAGE and immunoblotted for detection of the FLAG-tag sequence. (C) Phosphatase treatment of ectopically expressed p120ctn molecules. FLf and ΔN346f expressed in Colo 205 cells were affinity-purified with anti-FLAG M2 mAb, and incubated with protein phosphatase as described in Fig. 4 F. (D and E) Binding of FLf and ΔN346f to E-cadherin. In D, E-cadherin was immunoprecipitated from Colo 205 cells transfected with FLf or ΔN346f, and copurified proteins were analyzed with antibodies to E-cadherin (E-cad), FLAG (FLAG), and p120ctn (p120). In E, the total extracts of the same Colo 205 transfectants as used in D were immunoblotted for FLAG and p120ctn. The anti-p120ctn mAb used recognizes the COOH-terminal region, thus detecting both FLf and ΔN346f, as well as the endogenous molecules, whereas the anti-FLAG antibody detected only the ectopic molecules. Molecular weight markers in B, 175, 83, and 62 × 103; in D and E, 83 and 62 × 103.
Figure 6
Figure 6
Induction of compaction in Colo 205 aggregates by NH2 terminus–deleted p120ctn molecules. Colo 205 cells were transfected with cDNAs encoding FLf (A and A′), ΔN346f (B and B′), ΔN323f (C and C′), ΔN244f (D and D′), ΔN157f (E and E′), ΔN101f (F and F′), FLΔRf (G and G′), or ΔN346ΔRf (H and H′), and cultured for 72 h. Introduced molecules were detected with anti-FLAG antibody M2. (A–H) Phase-contrast images; (A′–H′) immunofluorescence staining for FLAG in the same fields as in A–H. ΔN346f and ΔN323f induced compaction in Colo 205 aggregates, and ΔN244f showed a partial effect. FLf, ΔN157f, ΔN101f, FLΔRf, and ΔN346ΔRf had no effect. Note that FLΔRf and ΔN346ΔRf are localized only in the cytoplasm, whereas the others also are distributed in the plasma membrane; the compaction-inducing constructs were concentrated at cell–cell contact sites. In most fields shown, not all cells express the ectopic molecules. In C and C′, arrows point to molecules concentrated at cell–cell adhesion sites, and arrowheads indicate cells not expressing the ectopic molecules. Bar, 20 μm.
Figure 8
Figure 8
Induction of compact cell aggregation by expression of N-cadherin without the p120ctn-binding site. (A) Schematic drawing of full-length N-cadherin and a mutant N-cadherin in which the juxtamembrane portion of the cytoplasmic domain was deleted and used for construction of adenoviral expression vectors, AdV-Ncad and AdV-cN/JM(−), respectively. TM, transmembrane domain. (B) Immunoblot analysis of catenins coprecipitated with N-cadherin. Colo 205 cells were infected with AdV-Ncad or AdV-cN/JM(−) and cultured for 48 h. Expressed N-cadherin proteins (N-cad) were immunoprecipitated with NCD-2, and the immunoprecipitants were analyzed for p120ctn (p120) or β-catenin (β-cat). Molecular weight markers, 175 and 83 × 103. (C) Morphological changes in Colo 205 cell aggregates induced by the mutant N-cadherin. Cells infected with AdV-Ncad or AdV-cN/JM(−) were cultured for 24 h and stained for N-cadherin. a and b, Immunofluorescence staining for N-cadherin; a′ and b′, phase-contrast images in the same fields as in a and b. Bar, 20 μm.

References

    1. Baeckstrom D, Hansson GC, Nilsson O, Johansson C, Gendler SJ, Lindholm L. Purification and characterization of a membrane-bound and a secreted mucin-type glycoprotein carrying the carcinoma-associated sialyl-Lea epitope on distinct core proteins. J Biol Chem. 1991;266:21537–21547. - PubMed
    1. Balsamo J, Arregui C, Leung T, Lilien J. The nonreceptor protein tyrosine phosphatase PTP1B binds to the cytoplasmic domain of N-cadherin and regulates the cadherin–actin linkage. J Cell Biol. 1998;143:523–532. - PMC - PubMed
    1. Barth AIM, Näthke IS, Nelson WJ. Cadherins, catenins and APC protein: interplay between cytoskeletal complexes and signaling pathways. Curr Opin Cell Biol. 1997;9:683–690. - PubMed
    1. Brieher WM, Yap AS, Gumbiner BM. Lateral dimerization is required for the homophilic binding activity of C-cadherin. J Cell Biol. 1996;135:487–496. - PMC - PubMed
    1. Calautti E, Cabodi S, Stein PL, Hatzfeld M, Kedersha N, Paolo G, Dotto Tyrosine phosphorylation and src family kinases control keratinocyte cell–cell adhesion. J Cell Biol. 1998;141:1449–1465. - PMC - PubMed

Publication types

MeSH terms

Substances