. 1999 May 15;517 ( Pt 1)(Pt 1):35-50.
doi: 10.1111/j.1469-7793.1999.0035z.x.

Modulation of neuronal and recombinant GABAA receptors by redox reagents

Affiliations

Modulation of neuronal and recombinant GABAA receptors by redox reagents

A Amato et al. J Physiol. .

Abstract

1. The functional role played by the postulated disulphide bridge in gamma-aminobutyric acid type A (GABAA) receptors and its susceptibility to oxidation and reduction were studied using recombinant (murine receptor subunits expressed in human embryonic kidney cells) and rat neuronal GABAA receptors in conjunction with whole-cell and single channel patch-clamp techniques. 2. The reducing agent dithiothreitol (DTT) reversibly potentiated GABA-activated responses (IGABA) of alpha1beta1 or alpha1beta2 receptors while the oxidizing reagent 5, 5'-dithio-bis-(2-nitrobenzoic acid) (DTNB) caused inhibition. Redox modulation of IGABA was independent of GABA concentration, membrane potential and the receptor agonist and did not affect the GABA EC50 or Hill coefficient. The endogenous antioxidant reduced glutathione (GSH) also potentiated IGABA in alpha1beta2 receptors, while both the oxidized form of DTT and glutathione (GSSG) caused small inhibitory effects. 3. Recombinant receptors composed of alpha1beta1gamma2S or alpha1beta2gamma2S were considerably less sensitive to DTT and DTNB. 4. For neuronal GABAA receptors, IGABA was enhanced by flurazepam and relatively unaffected by redox reagents. However, in cultured sympathetic neurones, nicotinic acetylcholine-activated responses were inhibited by DTT whilst in cerebellar granule neurones, NMDA-activated currents were potentiated by DTT and inhibited by DTNB. 5. Single GABA-activated ion channel currents exhibited a conductance of 16 pS for alpha1beta1 constructs. DTT did not affect the conductance or individual open time constants determined from dwell time histograms, but increased the mean open time by affecting the channel open probability without increasing the number of cell surface receptors. 6. A kinetic model of the effects of DTT and DTNB suggested that the receptor existed in equilibrium between oxidized and reduced forms. DTT increased the rate of entry into reduced receptor forms and also into desensitized states. DTNB reversed these kinetic effects. 7. Our results indicate that GABAA receptors formed by alpha and beta subunits are susceptible to regulation by redox agents. Inclusion of the gamma2 subunit in the receptor, or recording from some neuronal GABAA receptors, resulted in reduced sensitivity to DTT and DTNB. Given the suggested existence of alphabeta subunit complexes in some areas of the central nervous system together with the generation and release of endogenous redox compounds, native GABAA receptors may be subject to regulation by redox mechanisms.


Figures

Figure 1
Figure 1. Modulation by redox reagents of IGABA in α1β2 subunit GABAA receptors
A, whole-cell currents activated by 10 μM GABA and recorded at a holding potential of -40 mV from HEK cells expressing α1β2 receptor constructs. GABA was rapidly applied for the periods indicated by the horizontal bars in the presence and absence of 2 mM DTT or 0.5 mM DTNB. B, bar graph showing the amplitudes of the 10 μM GABA-activated current at the peak of the response (Ipeak) and 10 s after the start of the GABA application (I10) in the presence of 2 mM DTT or 0.5 mM DTNB (n = 8 cells). Control 10 μM GABA Ipeak and I10 amplitudes were designated 100 %. In this and subsequent bar graphs, each bar represents the mean ± s.e.m.C, membrane currents induced by 4 μM muscimol recorded from α1β2 constructs before, during and after application of 2 mM DTT. D, bar graph showing the enhancement by 2 mM DTT of the peak currents activated by 4 μM muscimol (IMusc) and 10 μM GABA (IGABA) (n = 3). Both control IMusc and IGABA in the absence of DTT were designated 100 %.
Figure 2
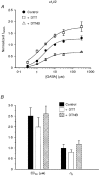
Figure 2. GABA equilibrium concentration-response curves for α1β2 receptors
A, concentration-peak response curves constructed for GABA in the absence (Control) and presence of 2 mM DTT or 0.5 mM DTNB for HEK cells expressing α1β2 subunits. The data (means ± s.e.m.) were normalized to the peak response to 10 μM GABA in control Krebs solution and fitted according to the logistic equation as described in Methods. B, bar graph of the GABA EC50 values and Hill coefficients (nH) for control, + 2 mM DTT and + 0.5 mM DTNB (n = 4-8 cells).
Figure 3
Figure 3. Modulation of GABA-activated currents by glutathione in α1β2 receptors
A, membrane currents induced by 10 μM GABA on HEK cells expressing α1β2 subunits in control Krebs solution and following pre-incubation for 3 min and subsequent co-application with 1-10 mM glutathione, in its reduced form (GSH), at a holding potential of -40 mV. B, bar graph of peak IGABA amplitudes activated by 10 μM GABA in control (100 %), following application of 2 mM oxidized DTT (OxDTT), + 2 mM reduced DTT (RedDTT, equivalent to DTT), + 5 mM oxidized glutathione (GSSG) and + 5 mM reduced glutathione (GSH) (n = 4 cells). Individual cells were exposed to up to 3 redox agents separated by full GABA response recoveries from preceding treatments.
Figure 4
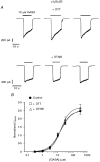
Figure 4. Redox modulation of γ2 subunit-containing GABAA receptors
A, whole-cell membrane currents activated by 10 μM GABA in two HEK cells expressing α1β2γ2S receptor constructs, prior to, during co-application and following recovery from 2 mM DTT (upper panel) or 0.5 mM DTNB (lower panel). B, equilibrium concentration-peak response curves for GABA constructed for α1β2γ2S receptors in control Krebs solution, and in the presence of 2 mM DTT or 0.5 mM DTNB. The data (means ± s.e.m.) were normalized to the peak response to 10 μM GABA and the points were fitted as described in Methods (n = 3-5).
Figure 5
Figure 5. Voltage sensitivity of redox modulation of recombinant GABAA receptors
A, typical membrane currents were recorded in response to 10 μM GABA in a single HEK cell expressing α1β2 receptors at different holding potentials between -70 and +30 mV in control Krebs solution and in the presence of 2 mM DTT (top). These data were used to construct current-voltage (I-V) relationships for the peak response to GABA (bottom). The chord conductance measured between -30 and -70 mV was 0.03 μS in control and 0.05 μS in 2 mM DTT. B, membrane currents evoked by 10 μM GABA recorded from a HEK cell expressing α1β2γ2S receptors at different membrane potentials. The I-V relationships for control and in the presence of DTT yielded chord conductances of approximately 0.015 μS. Vh, holding potential.
Figure 6
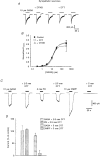
Figure 6. Sensitivity of GABAA and nicotinic acetylcholine receptors in sympathetic neurones to redox agents
A, whole-cell currents activated by 10 μM GABA in a cultured sympathetic neurone recorded at a holding potential of -50 mV in the presence and absence of 0.5 mM DTNB or 2 mM DTT. B, equilibrium concentration-peak response curves for GABA in control, 2 mM DTT and 0.5 mM DTNB from 6-11 cells. Data (means ± s.e.m.) were normalized to the control 10 μM GABA-activated peak response. C, membrane currents recorded from a single sympathetic neurone at a holding potential of -50 mV in response to 10 μM GABA, 2 mM pentobarbitone (PB) and 10 μM 1,1-dimethyl-4-phenylpiperazinium (DMPP) in the presence and absence of 2.5 or 5 mM DTT. D, bar graph showing the mean current amplitudes normalized with respect to the first response to 10 μM GABA, 2 mM PB or 10 μM DMPP in each cell, in the presence and absence of 2.5 or 5 mM DTT (n = 4 cells).
Figure 7
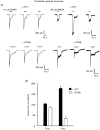
Figure 7. Redox modulation of native GABAA and NMDA receptors on cerebellar granule neurones
A, whole-cell membrane currents recorded from 2 cerebellar granule neurones activated by 10 μM GABA (left) and 20 μM NMDA (right) before, during and after application of 2 mM DTT (top) or 0.5 mM DTNB (bottom). Both IGABA and INMDA were recorded at a holding potential of -40 mV. B, bar graph showing the effect of 2 mM DTT and 0.5 mM DTNB on IGABA and INMDA in 4 cells. Currents are normalized to control values (100 %) in the absence of DTT and DTNB.
Figure 8
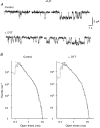
Figure 8. Single channel analysis of DTT modulation of α1β1 receptors
A, single channel currents recorded in outside-out patches at -90 mV excised from a HEK cell expressing α1β1 GABAA receptors. The patch was exposed to 0.1 μM GABA in the absence (Control) and presence of 1 mM DTT. B, open time histograms for GABA-activated ion channel currents at a holding potential of -90 mV. The time constants and associated areas were: control: τo1, 0.21 ± 0.02 ms (58 ± 10 %) and τo2, 1.15 ± 0.4 ms (42 ± 5 %); 1 mM DTT: τo1, 0.27 ± 0.06 ms (31 ± 5 %) and τo2, 1.35 ± 0.21 ms (69 ± 10 %).
Scheme 1
Scheme 1
Figure 9
Figure 9. Kinetic simulation of whole-cell GABA-activated currents and modulation by redox reagents
Theoretical computer simulated GABA-activated currents using Scheme 1, representing the effects of redox reagents DTT and DTNB on an α1βi GABAA receptor. Microscopic association (M s−1) and dissociation (s−1) transition rate constants were chosen partly empirically and also according to experimental observation. Currents were activated by 0.01, 0.07, 0.6, 5, 38 and 300 μM GABA with k1 = 5 M s−1; k2 = 0.7 s−1; k3 = 0.7 s−1; k4 = 0.04 s−1; k7 = 0.06 M s−1; k8 = 0.1 s−1; k9 = 0.6 s−1; k10 = 0.001 s−1; k11 = 0.1 s−1; k12 = 0.1 s−1; k13 = 0.006 M s−1; k14 = 0.01 s−1; k15 = 0.6 s−1; k16 = 0.001 s−1; k17 = 0.5 M s−1; k18 = 0.07 s−1; k19 = 0.7 s−1; k20 = 0.04 s−1; k22 = 0.01 s−1; k24 = 0.01 s−1; k21 and k23 were calculated as functions of the other rate constants according to the law of microscopic reversibility. In the presence of 2 mM DTT, the following rate constants were altered to: k3 = 1 s−1; k4 = 0.1 s−1; k11 = 1 s−1; and k12 = 0.01 s−1. In the presence of 0.5 mM DTNB, these rate constants were altered to: k3 = 0.7 s−1; k4 = 0.04 s−1; k11 = 0.01 s−1; and k12 = 100 s−1.

References

    1. Aizenman E, Lipton SA, Loring RH. Selective modulation of NMDA responses by reduction and oxidation. Neuron. 1989;2:1257–1263. 10.1016/0896-6273(89)90310-3. - DOI - PubMed
    1. Amato A, Moss SJ, Smart TG. Modulation of recombinant and rat neuronal GABAA receptors by redox reagents. The Journal of Physiology. 1996;493.P:44–45. P. - PMC - PubMed
    1. Amin J, Dickerson IM, Weiss DS. The agonist binding site of the γ-aminobutyric acid type A channel is not formed by the extracellular cysteine loop. Molecular Pharmacology. 1994;45:317–323. - PubMed
    1. Barnard EA, Darlison MG, Seeburg P. Molecular biology of the GABAA receptor: the receptor/channel superfamily. Trends in Neurosciences. 1987;10:502–509.
    1. Ben-Haim D, Landau EM, Silman I. The role of a reactive disulphide bond in the function of the acetylcholine receptor at the frog neuromuscular junction. The Journal of Physiology. 1973;234:305–325. - PMC - PubMed

Publication types

MeSH terms

LinkOut - more resources