. 1999 May 15;517 ( Pt 1)(Pt 1):85-93.
doi: 10.1111/j.1469-7793.1999.0085z.x.

Homologous and heterologous asynchronicity between identified alpha-, beta- and delta-cells within intact islets of Langerhans in the mouse

Affiliations

Homologous and heterologous asynchronicity between identified alpha-, beta- and delta-cells within intact islets of Langerhans in the mouse

A Nadal et al. J Physiol. .

Abstract

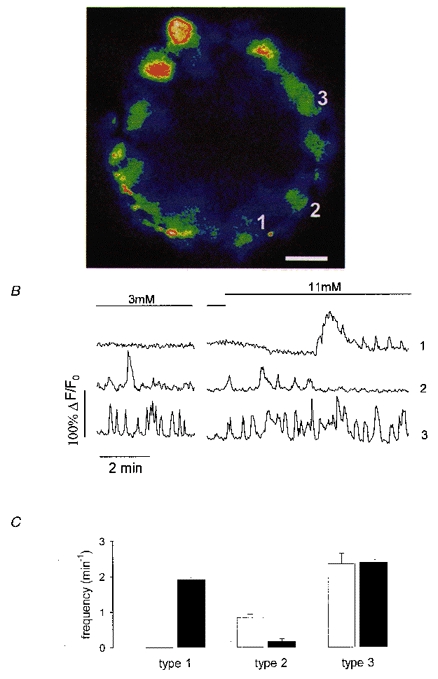
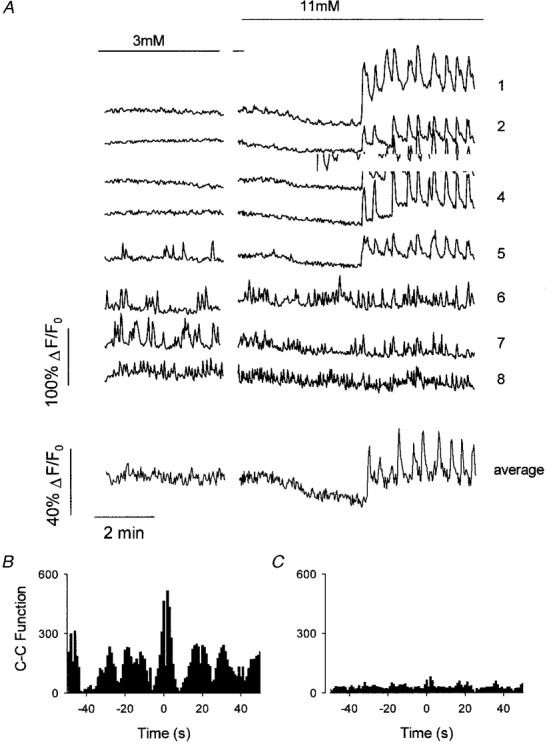
1. Using laser scanning confocal microscopy to image [Ca2+]i within intact murine islets of Langerhans, we analysed the [Ca2+]i signals generated by glucose in immunocytochemically identified alpha-, beta- and delta-cells. 2. Glucagon-containing alpha-cells exhibited [Ca2+]i oscillations in the absence of glucose, which petered out when islets were exposed to high glucose concentrations. 3. Somatostatin-containing delta-cells were silent in the absence of glucose but concentrations of glucose as low as 3 mM elicited oscillations. 4. In pancreatic beta-cells, a characteristic oscillatory calcium pattern was evoked when glucose levels were raised from 3 to 11 mM and this was synchronized throughout the beta-cell population. Remarkably, [Ca2+]i oscillations in non-beta-cells were completely asynchronous, both with respect to each other and to beta-cells. 5. These results demonstrate that the islet of Langerhans behaves as a functional syncytium only in terms of beta-cells, implying a pulsatile secretion of insulin. However, the lack of a co-ordinated calcium signal in alpha- and delta-cells implies that each cell acts as an independent functional unit and the concerted activity of these units results in a smoothly graded secretion of glucagon and somatostatin. Understanding the calcium signals underlying glucagon and somatostatin secretion may be of importance in the treatment of non-insulin-dependent diabetes mellitus since both glucagon and somatostatin appear to regulate insulin release in a paracrine fashion.


Figures

Figure 1
Figure 1. Fluorescence changes measured from individual cells within intact islets of Langerhans
A, colour image of a fluo-3 loaded islet exposed to 3 mM glucose. Blue corresponds to low and red to high fluorescence intensity. The scale bar at the bottom right represents 15 μm. B, records of fluorescence intensity versus time from the islet in A. The boundaries of each cell were clearly visible from the low fluorescence at the cell edge. Islets exposed to 3 mM glucose were switched to 11 mM glucose as indicated by the bars on the record. Traces 1, 2 and 3 correspond to the cells labelled in A. The time break was 10 min. C, frequency of [Ca2+]i oscillations for cells with the same [Ca2+]i pattern as cell 1 (type 1), cell 2 (type 2) and cell 3 (type 3) in 3 mM glucose (□) and 11 mM glucose (▪). Results are pooled from 261 cells in 15 different islets and are expressed as means ± s.e.m.
Figure 4
Figure 4. Asynchronicity between δ-cells and between δ- and β-cells
A, fluorescence records in response to a change from 3 to 11 mM glucose in 8 cells of an islet of Langerhans. Note that the stimulating glucose concentration (11 mM) induces synchronous oscillations in traces 1-5. Traces 6-8 represent cells with an oscillatory behaviour in the presence of 3 mM glucose. These cells were completely asynchronized and independent of glucose concentration. B, the cross-correlation (C-C) function from cells 3 and 4 clearly shows an oscillatory behaviour and a central peak, confirming the presence of highly correlated oscillatory events. Cell 3 was the reference cell. A cross-correlation function with any of the other cells (1-5) gave the same result. C, the cross-correlation function from cells 6 and 7 shows the absence of correlated events, confirming the total asynchronicity of δ-cells. Cell 6 was the reference cell. The cross-correlation function from cell 6 and cells 1-4 confirmed the absence of correlated events between δ-cells and β-cells.
Figure 2
Figure 2. Glucose induces different fluorescence signals in individual cells
A, changes in fluorescence induced by decreasing glucose concentrations in cells 1 and 2. The bars above the traces indicate the periods of application of different glucose concentrations. B, frequency of [Ca2+]i oscillations (ν) vs. glucose concentration for cells with the [Ca2+]i pattern of cell 1 (•), cell 2 (○) and cells with typical β-cell synchronous [Ca2+]i oscillations (▴). Points are the mean of 16 cells from 5 different islets. C, percentage of time that [Ca2+]i remained elevated vs. glucose concentration in the same cells as B; same symbols.
Figure 3
Figure 3. Identification of glucagon- and somatostatin-containing cells
A, fluorescence changes due to a change from 3 to 11 mM glucose from cells depicted in the left panel of B. Note that [Ca2+]i oscillations are abolished due to the presence of high glucose levels. B, left panel: picture of the two cells described in A loaded with the calcium indicator fluo-3. Blue indicates low and red high fluorescence levels. Right panel: identification of cells 1 and 2 as glucagon-containing α-cells by immunofluorescence, shown in green. The result is representative of 5 glucose-responsive cells unambiguously identified from 3 islets. Scale bar represents 15 μm. C, fluorescence signals due to a change from 3 to 11 mM glucose in the cell depicted in the left panel of D. No appreciable change in the frequency of [Ca2+]i oscillations was observed. D, left panel: pseudo-colour picture of the cell described in C within an islet of Langerhans. Right panel, identification of this cell as a somatostatin-containing δ-cell, labelled in green (4 glucose-responsive cells from 2 islets were unambiguously identified). Scale bar represents 15 μm.
Figure 5
Figure 5. Asynchrony amongst α-cells
A, [Ca2+]i oscillations in response to 3 mM glucose in α-cells, identified by the decrease in the frequency of [Ca2+]i oscillations in 11 mM glucose. Oscillations are asynchronous, as manifested by the cross-correlation function plotted in B. The average trace is the arithmetic mean of traces 1-4. The cross-correlation function from cells 2 and 3 (B) demonstrates the absence of correlated events. Essentially the same result was obtained when comparing cell 2 with the other cells. Cell 2 was the reference cell.

References

    1. Asada N, Shibuya I, Iwanaga T, Niwa K, Kanno T. Identification of α- and β-cells in intact isolated islets of Langerhans by their characteristic cytoplasmic Ca2+ concentration dynamics and immunocytochemical staining. Diabetes. 1998;47:751–757. - PubMed
    1. Barbosa RM, Silva AM, Tome AR, Stamford JA, Santos RM, Rosario LM. Real time electrochemical detection of 5-HT/insulin secretion from single pancreatic islets: effect of glucose and K+ depolarisation. Biochemical and Biophysical Research Communications. 1996;228:100–104. - PubMed
    1. Berts A, Ball A, Dryselius S, Gylfe E, Hellman B. Glucose stimulation of somatostatin-producing islet cells involves oscillatory Ca2+ signaling. Endocrinology. 1996a;137:693–697. - PubMed
    1. Berts A, Ball A, Gylfe E, Hellman B. Suppression of Ca2+ oscillations in glucagon-producing α2-cells by insulin/glucose and amino acids. Biochimica et Biophysica Acta. 1996b;1310:212–216. - PubMed
    1. Berts A, Gylfe E, Hellman B. Ca2+ oscillations in pancreatic islet cells secreting glucagon and somatostatin. Biochemical and Biophysical Research Communications. 1995;208:644–649. - PubMed

Publication types

LinkOut - more resources