Relationship between K+ channel down-regulation and [Ca2+]i in rat ventricular myocytes following myocardial infarction
- PMID: 10226162
- PMCID: PMC2269317
- DOI: 10.1111/j.1469-7793.1999.0229z.x
Relationship between K+ channel down-regulation and [Ca2+]i in rat ventricular myocytes following myocardial infarction
Abstract
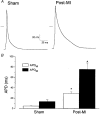
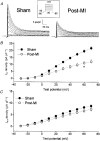
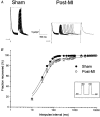
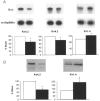
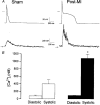
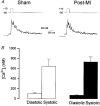
1. Cardiac hypertrophy and prolongation of the cardiac action potential are hallmark features of heart disease. We examined the molecular mechanisms and the functional consequences of this action potential prolongation on calcium handling in right ventricular myocytes obtained from rats 8 weeks following ligation of the left anterior descending coronary artery (post-myocardial infarction (MI) myocytes). 2. Compared with myocytes from sham-operated rats (sham myocytes), post-MI myocytes showed significant reductions in transient outward K+ current (Ito) density (sham 19.7 +/- 1.1 pA pF-1 versus post-MI 11.0 +/- 1.3 pA pF-1; means +/- s.e.m.), inward rectifier K+ current density (sham -13.7 +/- 0.6 pA pF-1 versus post-MI -10.3 +/- 0.9 pA pF-1) and resting membrane potential (sham -84.4 +/- 1.3 mV versus post-MI -74.1 +/- 2.6 mV). Depressed Ito amplitude correlated with significant reductions in Kv4.2 and Kv4.3 mRNA and Kv4.2 protein levels. Kv1.4 mRNA and protein levels were increased and coincided with the appearance of a slow component of recovery from inactivation for Ito. 3. In current-clamp recordings, post-MI myocytes showed a significant increase in [Ca2+]i transient amplitude compared with sham myocytes. Using voltage-clamp depolarizations, no intrinsic differences in Ca2+ handling by the sarcoplasmic reticulum or in L-type Ca2+ channel density (ICa,L) were detected between the groups. 4. Stimulation of post-MI myocytes with an action potential derived from a sham myocyte reduced the [Ca2+] transient amplitude to the sham level and vice versa. 5. The net Ca2+ influx per beat via ICa,L was increased about 2-fold in myocytes stimulated with post-MI action potentials compared with sham action potentials. 6. Our findings demonstrate that reductions in K+ channel expression in post-MI myocytes prolong action potential duration resulting in elevated Ca2+ influx and [Ca2+]i transients.
Figures




Similar articles
-
Effects of development and thyroid hormone on K+ currents and K+ channel gene expression in rat ventricle.J Physiol. 1997 Oct 15;504 ( Pt 2)(Pt 2):271-86. doi: 10.1111/j.1469-7793.1997.271be.x. J Physiol. 1997. PMID: 9365903 Free PMC article.
-
The thyroid hormone analog DITPA restores I(to) in rats after myocardial infarction.Am J Physiol Heart Circ Physiol. 2000 Apr;278(4):H1105-16. doi: 10.1152/ajpheart.2000.278.4.H1105. Am J Physiol Heart Circ Physiol. 2000. PMID: 10749704
-
Myocardial infarction in rat eliminates regional heterogeneity of AP profiles, I(to) K(+) currents, and [Ca(2+)](i) transients.Am J Physiol Heart Circ Physiol. 2002 Sep;283(3):H1157-68. doi: 10.1152/ajpheart.00518.2001. Am J Physiol Heart Circ Physiol. 2002. PMID: 12181147
-
Transient outward potassium current and Ca2+ homeostasis in the heart: beyond the action potential.Braz J Med Biol Res. 2006 Mar;39(3):393-403. doi: 10.1590/s0100-879x2006000300010. Epub 2006 Feb 22. Braz J Med Biol Res. 2006. PMID: 16501819 Review.
-
[Regulation of calcium liberation in sarcoplasmic reticulum and heart muscle cells].Verh K Acad Geneeskd Belg. 1997;59(5):401-34. Verh K Acad Geneeskd Belg. 1997. PMID: 9490926 Review. Dutch.
Cited by
-
A mathematical model of the electrophysiological alterations in rat ventricular myocytes in type-I diabetes.Biophys J. 2003 Feb;84(2 Pt 1):832-41. doi: 10.1016/S0006-3495(03)74902-9. Biophys J. 2003. PMID: 12547767 Free PMC article.
-
The potential role of Kv4.3 K+ channel in heart hypertrophy.Channels (Austin). 2014;8(3):203-9. doi: 10.4161/chan.28972. Channels (Austin). 2014. PMID: 24762397 Free PMC article. Review.
-
A new model of myofibroblast-cardiomyocyte interactions and their differences across species.Biophys J. 2021 Sep 7;120(17):3764-3775. doi: 10.1016/j.bpj.2021.06.040. Epub 2021 Jul 17. Biophys J. 2021. PMID: 34280368 Free PMC article.
-
A mathematical model of action potential heterogeneity in adult rat left ventricular myocytes.Biophys J. 2001 Dec;81(6):3029-51. doi: 10.1016/S0006-3495(01)75943-7. Biophys J. 2001. PMID: 11720973 Free PMC article.
-
Compensatory and decompensatory alterations in cardiomyocyte Ca2+ dynamics in hearts with diastolic dysfunction following aortic banding.J Physiol. 2017 Jun 15;595(12):3867-3889. doi: 10.1113/JP273879. Epub 2017 May 21. J Physiol. 2017. PMID: 28542952 Free PMC article.
References
-
- Afzal N, Dhalla NS. Differential changes in left and right ventricular SR calcium transport in congestive heart failure. American Journal of Physiology. 1992;262:H868–874. - PubMed
-
- Anand IS, Liu D, Chugh SS, Prahash AJ, Gupta S, John R, Popescu F, Chandrashekhar Y. Isolated myocyte contractile function is normal in post-infarct remodeled rat heart with systolic dysfunction. Circulation. 1997;96:3974–3984. - PubMed
-
- Apkon M, Nerbonne JM. Characterization of two distinct depolarization-activated K+ currents in isolated adult rat ventricular myocytes. Journal of General Physiology. 1991;97:973–1011. 10.1085/jgp.97.5.973. - DOI - PMC - PubMed
-
- Bailly P, Benitah J-P, Mouchonière M, Vassort G, Lorente P. Regional alteration of the transient outward current in human left ventricular septum during compensated hypertrophy. Circulation. 1997;96:1266–1274. - PubMed
-
- Benitah J-P, Gomez AM, Delgado C, Lorente P, Lederer WJ. A chloride current component induced by hypertrophy in rat ventricular myocytes. American Journal of Physiology. 1997;41:H2500–2506. - PubMed
Publication types
MeSH terms
Substances
LinkOut - more resources
Full Text Sources
Medical
Molecular Biology Databases
Miscellaneous

